ISSN 2561-2247
The original version was signed by
Kathleen Fox
Chair
Transportation Safety Board of Canada
The original version was signed by
The Honourable Dominic LeBlanc, P.C., Q.C., M.P
President of the Queen’s Privy Council for Canada
Chair's message
2019–20 was a busy year for the Transportation Safety Board of Canada (TSB), one marked by international collaboration, significant organizational changes, challenges faced and overcome, and bold transitions aimed at looking ahead to an uncertain future.
Early in the fiscal year, the TSB took part in meetings with key international partners: first as we hosted the heads of the International Transportation Safety Association (ITSA), in Quebec City; and later when senior TSB executives met with their counterparts from the National Transportation Safety Board (NTSB) in Washington, DC. Both events featured open, frank discussions on strategic issues and concerns.
August featured the arrival of a new chief operating officer, followed soon after by new directors in our Marine, Communications, and Rail/Pipeline branches. Each of these executives brings a wealth of knowledge and experience, and their arrival is key to the critical and ongoing process of organizational renewal.
January 2020 saw the tragic downing of Ukraine International Airlines Flight 752 in Iran. The TSB responded in the face of tremendous attention from across the country and around the world. In keeping with international agreements, we obtained Expert status in the investigation and sent two investigators to Tehran, where they received and reviewed factual information released by the Aircraft Accident Investigation Board of the Islamic Republic of Iran, which is leading the safety investigation as the State of Occurrence. Later, two TSB investigators travelled to Paris, France, to take part in the download of the aircraft’s flight recorders. At each step, we remained open and transparent about the limitations of what we were permitted to do and communicate under this process; we upheld our international commitments and responsibilities, and we liaised with other states and organizations—all with the goal of providing answers for the families and all Canadians.
During this period, the Board also held consultations with government and industry stakeholders to better inform the next edition of our Watchlist, which identifies those key safety issues that must be addressed to make Canada’s transportation system even safer. Over a four-month period from October to February, we received feedback from hundreds of delegates in the air, marine, and rail sectors. This information will be vital as we decide which issues have seen the greatest progress, and which ones require even more focus in the months ahead.
Finally, the end of the fiscal year brought yet another challenge, in the form of the COVID-19 pandemic. With our entire organization forced into an abrupt shift toward remote work, employees, managers, and executives alike migrated almost overnight to a virtual way of working. This “new normal” was made possible not only by the efforts of our IT department, but also because, thanks to our 2016–21 Strategic Plan, we were already well positioned toward such a pivot. Electronic signatures, greater use of videoconferencing, and more flexible work arrangements—all of these should help us continue to navigate the uncertain waters ahead.
In the meantime, the TSB’s “regular” business of investigating transportation occurrences continues. As always when something goes wrong, we will look to find out what happened and why, so that we can better communicate the needed safety improvements. In a constantly changing world, that focus is something Canadians, and the world, can rely on.
Kathleen Fox
Results at a glance and operating context
2019–20 Transportation Safety Board of Canada (TSB) Resource Utilization
- Financial: $35,700,486
- Human: 220 full-time equivalents
- The overall number of accidents in all modes reported in 2019 was almost 5% above the 2018 level, which is also 7% above the 10-year average.
- There were 36% more fatalities in 2019 across all transportation sectors than in 2018. This represents a 13% increase over the 10-year average.
- In 2019-20, the TSB began 66 new investigations, completed 50 investigations and had 84 investigations in progress at year-end.
- The Board reassessed the responses to 13 safety recommendations as Fully Satisfactory and issued 5 new recommendations during 2019-20. This brings the TSB to an overall total of 83% of its recommendations assessed as Fully Satisfactory – a 1.5 percentage point increase compared to March 2019.
- Following the January 2020 downing of Ukraine International Airlines Flight 752, the TSB deployed 2 investigators to Tehran to meet with Iranian investigators and visit the accident site. The TSB is doing everything possible within its authority to find answers for Canadians.
- The COVID-19 pandemic at year-end launched the TSB into an accelerated implementation to a digital workplace. A move to various electronic tools and digital systems have allowed the TSB to continue operating without any major disruptions during the ongoing pandemic.
- In 2019-20, the TSB held numerous consultations with key stakeholders in order to obtain their insights related to safety issues including multi-modal issues such as fatigue management and safety management and oversight. The feedback resulting from these consultations will serve as valuable input to the TSB’s next edition of its Watchlist to be released in the coming year.
Operating context: conditions affecting our work
The TSB operates within the context of a very large and complex Canadian and international transportation system. Many Canadian and foreign organizations are responsible for, and involved in, improving transportation safety. The TSB does not have any power or authority to direct others to implement its recommendations or to make changes. The Board must therefore present its findings and recommendations in such a manner that compels others to act. This implies ongoing dialogue, information sharing and strategic coordination with many organizations such as Transport Canada, the Canada Energy Regulator and the Canadian Coast Guard. The TSB must also engage industry and foreign regulatory organizations in a similar fashion. Through various means, the TSB must present compelling arguments that will convince these “agents of change” to allocate resources and take action in response to identified safety deficiencies despite their many other competing priorities.
Furthermore, with the increasing globalization of the transportation industry, governments and industry are seeking greater harmonization of policies and practices between countries in order to facilitate cross-border trade, as well as the movement of people and goods. For example, rules that apply to trains that cross the Canada / U.S. border on a daily basis must be harmonized in order to avoid slowing or stopping their movements or creating administrative issues for the companies. This in turn makes the TSB’s work more difficult. In order to achieve results (i.e. get safety actions implemented), the TSB can no longer simply engage and convince Canadian stakeholders to act on their own. The TSB must convince both Canadian and foreign stakeholders to take actions in a coordinated and consistent manner.
The TSB's volume of activities is influenced by the number, severity and complexity of transportation occurrences, none of which can be effectively predicted. This uncertainty poses certain challenges with respect to the planning and management of TSB resources. Additionally, over the past number of years the TSB’s visibility has increased significantly because of high-profile occurrence investigations, the TSB’s Outreach Program, and the increased use of social media to share safety information. The TSB’s enhanced visibility has generated higher stakeholder and public expectations than ever before.
In 2020-21, the TSB will continue its projects aimed at reviewing and modernizing its core business processes and its products so that the TSB can further optimize the use of its resources and adapt to changing public expectations. However, the management team will ensure that a proper balance is maintained between the achievement of the short and long-term objectives.
For more information on the TSB’s plans, priorities and results achieved, see the “Results: what we achieved” section of this report.
Results: what we achieved
Core Responsibilities
Independent safety investigations and communication of risks in the transportation system
Description
The Transportation Safety Board of Canada (TSB)’s sole objective is to advance air, marine, pipeline and rail transportation safety. This mandate is fulfilled by conducting independent investigations into selected transportation occurrences to identify the causes and contributing factors, and the safety deficiencies evidenced by these occurrences. The TSB makes recommendations to reduce or eliminate any such safety deficiencies and reports publicly on its investigations. The TSB then follows up with stakeholders to ensure that safety actions are taken to reduce risks and improve safety.
Planning highlights
The achievement of the TSB’s mandate is measured through three types of departmental result indicators. First, some performance indicators aim at reporting on the overall safety of the transportation system. However, many variables influence transportation safety and many organizations play a role in this ultimate outcome. There is no way to directly attribute overall safety improvements to any specific organization. Accident and fatality rates are used as the best available indicators. In recent years, these indicators have reflected positive advancements in transportation safety and we generally expected positive results again in 2019–20.
The TSB’s departmental results are also measured through actions taken by its stakeholders in response to its safety communications, as well as through efficiency indicators. The TSB must present compelling arguments that convince “change agents” to take actions in response to identified safety deficiencies. The responses received, the actions taken and their timeliness are good indicators of the TSB’s impact on transportation safety. The TSB actively engages with stakeholders in all modes. However, the established performance targets vary by mode to reflect the different baselines and the differing challenges from one mode to another. Good progress was made on a number of indicators during 2019–20. However, the TSB did not fully achieve all its targets for all performance indicators in all modes of transportation, as more time is required to fully implement the results of modernization initiatives.
Serving Canadians
In 2019–20, the TSB continued to make concerted efforts to maintain the quality of investigations and reports in all modes while improving their timeliness. This year, the TSB began 66 new investigations and completed 50 investigations of various classes.
There has been a slight increase in the average completion time of the various classes of investigations. The completion time for the safety issue class 1 investigation, a comprehensive study of safety issues in Canada’s air-taxi sector, was 1696 days. For the complex class 2 investigation was 680 days, compared to 598 days for the complex class 2 investigation completed in 2018–19. For the 22 detailed class 3 investigations completed in 2019–20, the average completion time of 493 days was 52 days longer than the 441 days for the 23 detailed class 3 investigations completed in 2018–19. This year, 26 limited-scope class 4 investigations were completed in an average of 228 days, slightly longer than the 224 days for the 48 limited-scope class 4 investigations completed in 2018–19.
With respect to responses to TSB recommendations, efforts continued to be made in collaboration with Transport Canada to review and take appropriate actions to close some older recommendations that have been outstanding for much too long. A particular focus was placed on aviation recommendations given the larger number of outstanding recommendations in that mode. In 2019–20, a total of 71 recommendations were reviewed, resulting in 13 recommendations being reassessed as fully satisfactory, which brought the overall total of fully satisfactory recommendations to 82.9%. The TSB also continued its outreach activities to engage stakeholders in proactive discussions and encourage them to initiate safety actions that can mitigate the risks identified.
Due to the nature of the work performed by the TSB, employees are subject to significant occupational health and safety hazards, stress and emotional trauma. In 2019–20, the TSB took concrete actions to create a workplace where the impact on employee well-being is minimized. In addition to finalizing its Mental Health Strategy, the TSB made the following Joint Learning Program training available to employees: Mental Health in the workplace, Preventing Harassment and Violence in the Workplace and Respecting Differences/ Anti-Discrimination. The TSB also amended its internal process for disclosure of harassment complaints and wrongdoing in the workplace to ensure transparency and instill confidence in the process for our employees.
Improving core business processes and products
In 2019–20, the TSB implemented amendments to the Policy on Occurrence Classification, including changes to its products and processes such as the addition of a new foreign investigation class 6. The introduction of foreign investigation class 6 enables the TSB to better report on time spent supporting investigations of foreign investigation bodies. Finally, the TSB reviewed and updated its timelines and performance targets for some classes of investigations.
The TSB updated its Policy on the Publication of Occurrence Data to define the TSB’s approach to publishing the occurrence data it collects. The Policy on Representations on Confidential Draft Reports was updated to better define the criteria for the selection of Designated reviewers who are invited to make representations on confidential draft reports (CDRs) and to establish a framework for handling representations on CDRs. Finally, the Policy on the Retention and Disposal of Physical Items was developed to establish the TSB’s procedures with respect to the handling, retention and disposal of physical items collected by the TSB for investigation purposes. These new and updated policies will enable the TSB to better manage stakeholder and public expectations in future years, as well as streamline TSB internal processes.
Modernizing our workplace
In 2019–20, the TSB continued to implement initiatives aimed at modernizing its workplace to facilitate teamwork, leverage the benefits of technology and achieve the best possible outcomes with efficient interconnected and nimble processes, structures and systems. Notably, the TSB began work required to implement the GC mandated system for electronic document management (GC docs) for all non-investigation files. The TSB also continued efforts to develop a single Project Tracking Tool that will replace the multiple independent applications currently used to manage projects by different branches within the organization. Major investments were made to acquire current IT tools, thereby providing employees with the flexibility to work from anywhere. The TSB implemented a renewed in-house competency-based investigator training program. Significant efforts and investments were made to update our facilities as well as to modernize our occupational health and safety and employee well-being programs. Planning continued to modernize our Head Office and Engineering Laboratory accommodations and equipment.
Over the course of 2019–20, the TSB developed and implemented a strategy to guide its interactions with Indigenous Peoples during investigations. This strategy aligns the TSB with the government’s priority of reconciliation and renewed relationship with Indigenous Peoples. Under the strategy, the TSB held awareness training for investigators and media relations staff.
Updating legislative and regulatory frameworks
One of the long-standing safety issues in the rail mode has been the call for the implementation of locomotive voice and video recorders (LVVR). These recorders could provide very valuable information to assist TSB investigators in their work, and could also help the railways proactively manage safety within the context of their safety management systems. In collaboration with Transport Canada, the TSB provided technical advice on the development of draft regulations for the implementation of locomotive voice and video recorders (LVVR). The regulations were published in the Canada Gazette, Part I in the spring 2019.
Key Risk(s) : things that could affect our ability to achieve our plans and results
The TSB faces key strategic risks that represent a potential threat to the achievement of its mandate. These risks warrant particular vigilance from all levels of the organization.
There is a risk that the TSB's credibility and operational effectiveness could be impacted if it fails to keep pace with the technological changes in the transportation industry. The TSB operates within the context of a very large Canadian and international transportation system that is growing in complexity because of rapid technological changes. New designs, the increasing level of automation in operations and the introduction of remotely piloted devices into existing transportation systems are only some examples that highlight this challenging environment. Advances in technology are also leading to exponential growth in the data available for investigations and other safety analyses. The TSB must evolve to ensure new data sources are properly exploited, optimally managed and fully analyzed.
There is a risk that TSB employees do not have access to current technology tools, systems, and applications to ensure that they can deliver their work in an efficient and effective manner. This includes having the appropriate IT infrastructure and applications in place, as well as the required Laboratory equipment. The TSB must make use of current versions of all IT operating systems/platforms and software applications in order to ensure the availability of maintenance and support from suppliers. There is also a need to ensure that these tools are not subject to business disruptions by third parties or events such as natural disasters (i.e. cyber attacks, floods).
Another challenge is the need to be vigilant with respect to managing employees and their wellbeing. Due to the nature of the work performed by the TSB, employees may be exposed to significant workplace stress and emotional trauma. TSB investigators are regularly exposed to accident sites involving injury and death, as well as to direct interaction with distraught survivors and families of victims. Vicarious trauma may also be experienced by other employees who are exposed to certain facets of investigations. Employees have also expressed concerns about harassment and having a respectful workplace. Without a healthy workforce, the TSB would not be able to deliver its mandate and achieve its strategic objectives.
There is an operational readiness risk that could impair the TSB's ability to deliver on its mandate in a continuous and on-going manner. There is a risk that the TSB may not be able to deploy in a timely manner, and to sustain operations, in the Arctic and remote regions due to the limited availability of transportation services and support infrastructure. There is also a risk that modal contingency plans will not be robust enough and sufficiently practised to ensure a proper state of readiness. Further, there is a risk that our planning and logistic support may not be appropriate for Arctic deployments and to command and control events at a major disaster site. These risks are compounded by the fact that there are many instances where there is only one person responsible for a specific task or with a specific expertise, should this person be unavailable it could put the organization at greater risk. The TSB has also encountered challenges in the recruitment and retention of experienced and qualified personnel in certain operational areas due to higher private sector salaries, a shortage of skilled workers, and the on-going retirement of the baby-boomer cohort of employees. Furthermore, due to the small size of its workforce, the TSB may not be able to handle two major occurrences at the same time.
Managing workload and expectations is a significant challenge. The TSB's workload (volume of activities) is influenced by the number, severity and complexity of transportation occurrences, and the workload cannot be predicted effectively. This uncertainty poses certain challenges with respect to the planning and management of TSB resources which in turn can affect our ability to effectively deliver on our mandate. Over the past few years, the TSB's visibility has increased significantly as a result of high-profile occurrence investigations, the TSB's Outreach Program, and the increased use of social media to share safety information. Our solid reputation and enhanced visibility have generated higher stakeholder and public expectations, and these expectations are expected to continue to increase. Furthermore, government-wide imposed systems, policies and directives have increased significantly in recent years (including HR systems, information management, Open Government, Canada website, travel, security), resulting in additional work that is not directly related to the delivery of the TSB's mandate.
Another risk faced by the TSB is legal challenges to its business processes, powers of investigators and its legislation. As Canadian society becomes more litigious, people and organizations seek greater compensation for losses or damages. Litigants want timely information to file early lawsuits and seek resolution of their claims. This has resulted in an increase in the number of requests for TSB information not only through the Access to Information process but also through the Courts (Motions to disclose or to produce). These requests typically seek to obtain investigator notes, witness statements, draft documents, correspondence and other records for uses that are not necessarily consistent with the TSB mandate of advancing transportation safety. There has also been a greater push on the TSB to release privileged information such as on-board voice recordings and transcripts, as well as witness statements. Furthermore, organizations and individuals are more frequently challenging the TSB business processes, as well as the application of the Canadian Transportation Accident Investigation and Safety Board (CTAISB) Act. If the TSB does not maintain robust investigation and IM processes which are applied consistently across the organization, as well as ensure the enforcement and compliance with its enabling legislation, there is a risk that the Courts could issue rulings that negatively impact on the way that the TSB conducts its work.
Experimentation
The TSB has not done any experimentation in 2019-20.
Results achieved
Notes about the Indicators:
Accident rate
This indicator is measured as follows:
- For Air, the rate is the number of accidents per 100,000 hours flown in Canada (excluding ultralights and other aircraft types).
- For Marine, the rate is the number of shipping accidents involving Canadian-flag commercial vessels of 15 gross tons or more (excluding passenger vessels and fishing vessels) per million vessel-kilometres.
- For Pipeline, the rate is accidents per exajoule.
- For Rail, the rate is main-track accidents per million main-track train miles.
To determine whether the target for this indicator has been met, the accident rates for the current year are compared against the 10-year average. Where the current year result is below or is equal to the 10-year average, the target is identified as met. For Marine, the metric on vessel-kilometres is only available for 2015 to 2019. For this metric, where the current year result is below or is equal to the 4-year average, the target is identified as met.
Number of fatal accidents
This indicator is measured by comparing the number of fatal accidents for the current year against the 10-year average. Where the current year result equals the 10-year average, the target is identified as met.
Average time recommendations have been outstanding (active and dormant recommendations)
The target for this performance indicator is set annually to reflect realistic goals based upon known circumstances at the time of planning.
Percentage of responses to recommendations assessed as Fully Satisfactory
The target for this performance indicator is set annually to reflect realistic goals based on known circumstances at the time of planning.
Average time for completing investigation reports
Replaced by new indicators as per the TSB Policy on Occurrence Classification starting in fiscal year 2019-20.
Percentage of investigations completed within the published target time
Indicator eliminated, as per the TSB Policy on Occurrence Classification starting in fiscal year 2019-20.
Average time to complete a class 4 safety issue investigation
Starting in fiscal year 2020-21, the target for this performance indicator is to be replaced with “220 days” to reflect amendments to the TSB Policy on Occurrence Classification.
Average time to complete a class 5 data-gathering investigation
Starting in fiscal year 2020-21, this performance indicator is to be replaced with the following two indicators to reflect amendments to the TSB Policy on Occurrence Classification:
| Departmental results | Performance Indicators | Target |
|---|---|---|
| Occurrences investigations are efficient | Average time to complete a class 5 data-gathering investigation (with deployment) | 90 days |
| Occurrences investigations are efficient | Average time to complete a class 5 data-gathering investigation (without deployment) | 60 days |
Air:
| Departmental results | Performance Indicators | Target | Date to achieve target | 2019–20 Actual results |
2018–19 Actual results |
2017–18 Actual results |
|---|---|---|---|---|---|---|
| Transportation system is safer | Accident rate (over 10-year period) | Continue downward trend in accident rate | March 2020 | Met The aviation accident rate in 2019 was 3.7 accidents per 100,000 hours flown, below the 10-year average of 4.9. |
Met The aviation accident rate in 2018 was 3.5 accidents per 100,000 hours flown, below the 10-year average of 5.2. |
Met The aviation accident rate in 2017 was 4.3 accidents per 100,000 hours flown, below the 10-year average of 4.8. |
| Transportation system is safer | Number of fatal accidents (over 10-year period) | Reduction in number of fatal accidents | March 2020 | Not met The number of fatal accidents was 33, higher than the 10-year average of 30 and fatalities in 2019 totalled 70, higher than the 10-year average of 52. |
Met The number of fatal accidents was 23, below the 10-year average of 32 and fatalities in 2018 totalled 38, lower than the 10-year average of 55. |
Met The number of fatal accidents was 21, below the 10-year average of 33 and fatalities in 2017 totalled 32, lower than the 10-year average of 5. |
| The regulators and the transportation industry respond to identified safety deficiencies | Percentage of responses to recommendations assessed as Fully Satisfactory | 74% | March 2020 | Met 77% |
Met 75% |
Met 73% |
| The regulators and the transportation industry respond to identified safety deficiencies | Percentage of safety advisories on which safety actions have been taken | 75% | March 2020 | Met 100% |
Met 75% |
Met 100% |
| The regulators and the transportation industry respond to identified safety deficiencies | Average time recommendations have been outstanding (active and dormant recommendations) | 12 years Ultimate goal of achieving an average of 7 years | March 2020 March 2021 | Met 10.5 years |
Met 11 years |
Not met 12.4 years |
| Occurrence investigations are efficient | Average time for completing investigation reports | 450 days | March 2020 | Not applicable | Met 278 days |
Not met 545 days |
| Occurrence investigations are efficient | Percentage of investigations completed within the published target time | 75% | March 2020 | Not applicable | Met 87% |
Not met 28% |
| Occurrence investigations are efficient | Average time to complete a class 1 safety issue investigation | 730 days | March 2020 | Not met 1696 days |
Met 689 days |
Not applicable |
| Occurrence investigations are efficient | Average time to complete a class 2 complex investigation | 600 days | March 2020 | Not met 686 days |
Met 550 days |
Not applicable |
| Occurrence investigations are efficient | Average time to complete a class 3 detailed investigation | 450 days | March 2020 | Met 428 days |
Met 447 days |
Not applicable |
| Occurrence investigations are efficient | Average time to complete a class 4 limited-scope investigation | 200 days | March 2020 | Not met 212 days |
Met 192 days |
Not applicable |
| Occurrence investigations are efficient | Average time to complete a class 5 data-gathering investigation | 60 days | March 2020 | Met 39 days |
Met 14 days |
Not applicable |
Marine:
| Departmental results | Performance Indicators | Target | Date to achieve target | 2019–20 Actual results |
2018–19 Actual results |
2017–18 Actual results |
|---|---|---|---|---|---|---|
| Transportation system is safer | Accident rate (over 10-year period) | Continue downward trend in accident rate | March 2020 | Not met The marine accident rates in 2019 were: 4.9 accidents per million vessel-kilometres for Canadian flag commercial vessels, below the 4-year average of 6.3. 2.0 accident per million vessel-kilometres for foreign commercial non-fishing vessels, above the 4-year average of 1.6. 5.0 accidents per 1,000 active fishing vessels, below the 10-year average of 6.2. |
Met The marine accident rates in 2018 were: 1.0 accident per 1,000 vessel movements for foreign commercial non-fishing vessels, below the 10-year average of 1.5. 5.1 accidents per 1,000 active fishing vessels,10-year average of 6.3. |
Met The marine accident rates in 2017 were: 1.3 accidents per 1,000 vessel movements for foreign commercial non-fishing vessels, below the 10-year average of 1.5. 5.8 accidents per 1,000 active fishing vessels, below the 10-year average of 6.7. |
| Transportation system is safer | Number of fatal accidents (over 10-year period) | Reduction in number of fatal accidents | March 2020 | Not met The number of fatal accidents was 13, above the 10-year average of 11.3 and the number of fatalities in 2019 totalled 17, above the 10-year average of 15.2. |
Not met The number of fatal accidents was 14, above the 10-year average of 11.9 and the number of fatalities in 2018 totalled 22, above the 10-year average of 16.0. |
Not met The number of fatal accidents was 10, below the 10-year average of 12.4 and the number of fatalities in 2017 totalled 11, lower than the 10-year average of 16.4. |
| The regulators and the transportation industry respond to identified safety deficiencies | Percentage of responses to recommendations assessed as Fully Satisfactory | 85% | March 2020 | Met 85% |
Not met 83% |
Met 86% |
| The regulators and the transportation industry respond to identified safety deficiencies | Percentage of safety advisories on which safety actions have been taken | 60% | March 2020 | Not met 33% |
Met 60% |
Not met 0% |
| The regulators and the transportation industry respond to identified safety deficiencies | Average time recommendations have been outstanding (active and dormant recommendations) | 10.5 years Ultimate goal of achieving an average of 7 years | March 2020 March 2021 | Not met 10.6 years |
Met 10.6 years |
Not met 10.9 years |
| Occurrence investigations are efficient | Average time for completing investigation reports | 450 days | March 2020 | Not applicable | Met 358 days |
Not met 466 days |
| Occurrence investigations are efficient | Percentage of investigations completed within the published target time | 75% | March 2020 | Not applicable | Met 77% |
Not met 50% |
| Occurrence investigations are efficient | Average time to complete a class 1 safety issue investigation | 730 days | March 2020 | Not applicable | Not applicable | Not applicable |
| Occurrence investigations are efficient | Average time to complete a class 2 complex investigation | 600 days | March 2020 | Not applicable | Met 574 days |
Not applicable |
| Occurrence investigations are efficient | Average time to complete a class 3 detailed investigation | 450 days | March 2020 | Not met 548 days |
Met 417 days |
Not applicable |
| Occurrence investigations are efficient | Average time to complete a class 4 limited-scope investigation | 200 days | March 2020 | Not met 341 days |
Not met 294 days |
Not applicable |
| Occurrence investigations are efficient | Average time to complete a class 5 data-gathering investigation | 60 days | March 2020 | Met 30 days |
Met 52 days |
Not applicable |
Pipeline:
| Departmental results | Performance Indicators | Target | Date to achieve target | 2019–20 Actual results |
2018–19 Actual results |
2017–18 Actual results |
|---|---|---|---|---|---|---|
| Transportation system is safer | Accident rate (over 10-year period) | Continue downward trend in accident rate | March 2020 | Met The 2019 rate was 0.0 pipeline accidents per exajoule, below the 10-year average of 0.4. |
Met The 2018 rate was 0.06 pipeline accidents per exajoule, below the 10-year average of 0.3. |
Met The 2017 rate was 0.3 pipeline accidents per exajoule, below the 10-year average of 0.5. |
| Transportation system is safer | Number of fatal accidents (over 10-year period) | Reduction in number of fatal accidents | March 2020 | Met There have been no fatal accidents. |
Met There have been no fatal accidents. |
Met There have been no fatal accidents. |
| The regulators and the transportation industry respond to identified safety deficiencies | Percentage of responses to recommendations assessed as Fully Satisfactory | 100% | March 2020 | Met 100% |
Met 100% |
Met 100% |
| The regulators and the transportation industry respond to identified safety deficiencies | Percentage of safety advisories on which safety actions have been taken | 75% | March 2020 | Met 100% |
Not applicable | Not applicable |
| The regulators and the transportation industry respond to identified safety deficiencies | Average time recommendations have been outstanding (active and dormant recommendations) | Ultimate goal of achieving an average of 7 years | March 2021 | Not applicable | Not applicable | Not applicable |
| Occurrence investigations are efficient | Average time for completing investigation reports | 450 days | March 2020 | Not applicable | Met 393 days |
Met 275 days |
| Occurrence investigations are efficient | Percentage of investigations completed within the published target time | 75% | March 2020 | Not applicable | Not met 50% |
Met 100% |
| Occurrence investigations are efficient | Average time to complete a class 1 safety issue investigation | 730 days | March 2020 | Not applicable | Not applicable | Not applicable |
| Occurrence investigations are efficient | Average time to complete a class 2 complex investigation | 600 days | March 2020 | Not applicable | Not applicable | Not applicable |
| Occurrence investigations are efficient | Average time to complete a class 3 detailed investigation | 450 days | March 2020 | Not met 513 days |
Not met 522 days |
Not applicable |
| Occurrence investigations are efficient | Average time to complete a class 4 limited-scope investigation | 200 days | March 2020 | Not applicable | Not met 264 days |
Not applicable |
| Occurrence investigations are efficient | Average time to complete a class 5 data-gathering investigation | 60 days | March 2020 | Not met 62 days |
Not met 165 days |
Not applicable |
Rail:
| Departmental results | Performance Indicators | Target | Date to achieve target | 2019–20 Actual results |
2018–19 Actual results |
2017–18 Actual results |
|---|---|---|---|---|---|---|
| Transportation system is safer | Accident rate (over 10-year period) | Continue downward trend in accident rate | March 2020 | Not met The main-track accident rate in 2019 was 3.3 accidents per million main-track train miles, above the 10-year average of 2.3. |
Not met The main-track accident rate in 2018 was 2.6 accidents per million main-track train miles, above the 10-year average of 2.3. |
Not met The main-track accident rate in 2017 was 2.6 accidents per million main-track train miles, above the 10-year average of 2.4. |
| Transportation system is safer | Number of fatal accidents (over 10-year period) | Reduction in number of fatal accidents | March 2020 | Not met The number of fatal accidents in 2019 was 68, above the 10-year average of 64.6. Rail fatalities totalled 72 in 2019, below the 10-year average of 72.8. |
Met The number of fatal accidents in 2018 was 55, below the 10-year average of 66. Rail fatalities totalled 57 in 2018, below the 10-year average of 74. |
Met The number of fatal accidents in 2017 was 75, above the 10-year average of 67. Rail fatalities totalled 77 in 2017, above the 10-year average of 76. |
| The regulators and the transportation industry respond to identified safety deficiencies | Percentage of responses to recommendations assessed as Fully Satisfactory | 88% | March 2020 | Met 90% |
Met 88% |
Not met 88% |
| The regulators and the transportation industry respond to identified safety deficiencies | Percentage of safety advisories on which safety actions have been taken | 60% | March 2020 | Not met 11% |
Not met 11% |
Not met 29% |
| The regulators and the transportation industry respond to identified safety deficiencies | Average time recommendations have been outstanding (active and dormant recommendations) | Ultimate goal of achieving an average of 7 years | March 2021 | Not met 9.2 years |
Not met 7.8 years |
Met 6.5 years |
| Occurrence investigations are efficient | Average time for completing investigation reports | 450 days | March 2020 | Not applicable | Met 373 days |
Not met 481 days |
| Occurrence investigations are efficient | Percentage of investigations completed within the published target time | 75% | March 2020 | Not applicable | Not met 69% |
Not met 40% |
| Occurrence investigations are efficient | Average time to complete a class 1 safety issue investigation | 730 days | March 2020 | Not applicable | Not applicable | Not applicable |
| Occurrence investigations are efficient | Average time to complete a class 2 complex investigation | 600 days | March 2020 | Not applicable | Not met 672 days |
Not applicable |
| Occurrence investigations are efficient | Average time to complete a class 3 detailed investigation | 450 days | March 2020 | Not met 520 days |
Met 447 days |
Not applicable |
| Occurrence investigations are efficient | Average time to complete a class 4 limited-scope investigation | 200 days | March 2020 | Not met 219 days |
Not met 214 days |
Not applicable |
| Occurrence investigations are efficient | Average time to complete a class 5 data-gathering investigation | 60 days | March 2020 | Not met 105 days |
Met 51 days |
Not applicable |
Budgetary financial resources (dollars)
| 2019–20 Main Estimates |
2019–20 Planned spending |
2019–20 Total authorities available for use |
2019–20 Actual spending (authorities used) |
2019–20 Difference (Actual spending minus Planned spending) |
|---|---|---|---|---|
| 26,586,536 | 26,586,536 | 29,359,745 | 28,806,211 | 2,219,675 |
Human resources (full-time equivalents)
| 2019–20 Planned full-time equivalents |
2019–20 Actual full-time equivalents |
2019–20 Difference (Actual full-time equivalents minus Planned full-time equivalents) |
|---|---|---|
| 172 | 173 | 1 |
Financial, human resources and performance information for the TSB’s Program Inventory is available in GC InfoBaseFootnote i.
Internal Services
Description
Internal Services are those groups of related activities and resources that the federal government considers to be services in support of programs and/or required to meet corporate obligations of an organization. Internal Services refers to the activities and resources of the 10 distinct service categories that support Program delivery in the organization, regardless of the Internal Services delivery model in a department. The 10 service categories are:
- Acquisition Management Services
- Communication Services
- Financial Management Services
- Human Resources Management Services
- Information Management Services
- Information Technology Services
- Legal Services
- Material Management Services
- Management and Oversight Services
- Real Property Management Services
Results
To continue to improve delivery of its services, several corporate processes were reviewed, streamlined and documented.
E-signatures were originally deployed as a pilot project for supplier payments in January 2020. Timelines for full deployment to all employees for all internal services were subsequently advanced to March 2020 in response to the COVID-19 pandemic. Other additional tools were also provided to all employees to enable them to successfully work remotely. Planning done for internal services over the last few years on TSB’s digital strategy ensured a smooth transition to remote working with minimal disruption.
The Finance Division continued to work in collaboration with the HR Division and PSPC compensation personnel to ensure that Phoenix issues were minimized and employees were paid in a timely manner. Where appropriate, cash advances were issued to employees.
The project to co-locate the TSB’s Head Office and Engineering Lab in a modern facility within the National Capital Region through participation in the Laboratories Canada Initiative is progressing as planned.
Budgetary financial resources (dollars)
| 2019–20 Main Estimates |
2019–20 Planned spending |
2019–20 Total authorities available for use |
2019–20 Actual spending (authorities used) |
2019–20 Difference (Actual spending minus Planned spending) |
|---|---|---|---|---|
| 6,646,634 | 6,646,634 | 7,026,754 | 6,894,275 | 247,641 |
Human resources (full-time equivalents)
| 2019–20 Planned full-time equivalents |
2019–20 Actual full-time equivalents |
2019–20 Difference (Actual full-time equivalents minus Planned full-time equivalents) |
|---|---|---|
| 50 | 47 | (3) |
Analysis of trends in spending and human resources
Actual expenditures
Departmental spending trend graph
The following graph presents planned (voted and statutory spending) over time.

Budgetary performance summary for Core Responsibilities and Internal Services (dollars)
| Core responsibilities and Internal Services | 2019–20 Main Estimates |
2019–20 Planned spending |
2020–21 Planned spending |
2021–22 Planned spending |
2019–20 Total authorities available for use |
2017–18 Actual spending (authorities used) | 2018–19 Actual spending (authorities used) | 2019–20 Actual spending (authorities used) |
|---|---|---|---|---|---|---|---|---|
| Independent safety investigations and communication of risks in the transportation system | 26,586,536 | 26,586,536 | 26,886,508 | 26,785,356 | 29,359,745 | 26,156,576 | 25,337,317 | 28,806,211 |
| Internal Services | 6,646,634 | 6,646,634 | 6,721,627 | 6,696,339 | 7,026,754 | 6,252,708 | 6,783,585 | 6,894,275 |
| Total | 33,233,170 | 33,233,170 | 33,608,135 | 33,481,695 | 36,386,499 | 32,409,284 | 32,120,902 | 35,700,486 |
The 2017-18 to 2019-20 actual spending results are actual amounts as published in the Public Accounts of Canada. The significant increase in actual spending in 2019-20 when compared to prior years is mainly due to higher salary expenditures in the form of retroactive payments for previous years as well as current year wage increases. These increases are in accordance with signed and ratified collective agreements. The TSB also progressed in its staffing of vacant positions and had higher expenditures for contracts related to legal services and digital transformation projects.
The significant increase of $3.2M between 2019-20 planned spending and 2019-20 total authorities (available for use) is explained by the additional authorities the TSB received throughout the fiscal year:
- $1.5M for retroactive payments and current year wage increases for signed and ratified collective agreements
- $1.1M for its operating budget carry forward from 2018-19
- $0.3M as a result of its Memorandum of Understanding (MOU) with Laboratories Canada
The remaining $0.3M is a combination other authorities in lesser amounts but is mainly comprised of the gains from the sale of capital assets and the annual employee benefit plan (EBP) rate adjustment set by Treasury Board Secretariat.
In accordance with the definition of planned spending, amounts for 2020-21 and ongoing fiscal years consist of Main Estimates and Annual Reference Level amounts only. The increase in planned spending for 2020-21 ($0.4M) and 2021-22 ($0.2M) when compared to 2019-20 Main Estimates is primarily due to additional funding received for collective bargaining increases. Furthermore, in 2020-21 Main Estimates, the TSB received an additional transfer of $0.2M in funding as a result of its Memorandum of Understanding (MOU) with Laboratories Canada.
Actual human resources
Human resources summary for core responsibilities and Internal Services
| Core responsibilities and Internal Services | 2017–18 Actual full-time equivalents | 2018–19 Actual full-time equivalents | 2019–20 Planned full-time equivalents |
2019–20 Actual full-time equivalents | 2020–21 Planned full-time equivalents | 2021–22 Planned full-time equivalents |
|---|---|---|---|---|---|---|
| Independent safety investigations and communication of risks in the transportation system | 169 | 163 | 172 | 173 | 177 | 177 |
| Internal Services | 45 | 46 | 50 | 47 | 50 | 50 |
| Total | 214 | 209 | 222 | 220 | 227 | 227 |
Actual full-time equivalents (FTEs) for 2018-19 and prior years were less than the anticipated due to vacant positions. Actual FTEs for 2019-20 are only slightly under the 2019-20 planned figures. Planned FTEs for 2020-21 and 2021-22 have increased to 227, a result of continued vacancy filling as well as some internal reorganizations.
Expenditures by vote
For information on the TSB’s organizational voted and statutory expenditures, consult the Public Accounts of Canada 2019–2020.Footnote ii
Government of Canada spending and activities
Information on the alignment of the TSB’s spending with the Government of Canada’s spending and activities is available in GC InfoBase.Footnote iii
Financial statements and financial statements highlights
Financial statements
The TSB’s financial statements (unaudited) for the year ended March 31, 2020, are available on the departmental website.
Financial statement highlights
Condensed Statement of Operations (unaudited) for the year ended March 31, 2020 (dollars)
| Financial information | 2019–20 Planned results |
2019–20 Actual results |
2018–19 Actual results |
Difference (2019–20 Actual results minus 2019–20 Planned results) |
Difference (2019–20 Actual results minus 2018–19 Actual results) |
|---|---|---|---|---|---|
| Total expenses | 38,458 | 40,411 | 36,239 | 1,953 | 4,172 |
| Total revenues | 35 | 28 | 23 | (7) | 5 |
| Net cost of operations before government funding and transfers | 38,423 | 40,383 | 36,216 | 1,960 | 4,167 |
The 2019–20 Planned Results are based on estimates known at the time of the Departmental Plan. The difference between total expenses for 2019–20 planned results and 2019–20 actual results is mainly due to events not known during the Departmental Plan preparation phase. Planned expenses for 2019-20 were estimated at $38.4 million while actual expenses are higher at $40.4 million which is mainly reflective of higher salaries and retroactive payments to employees.
On an accrual accounting basis, TSB total operating expenses for 2019-20 are $40.4 million, an increase of $4.2 million (11.6%) when compared to the previous fiscal year. The majority is attributed to salaries and employee benefits ($3.3M) due to higher employee salaries and retroactive payments for signed and ratified collective agreements and increased filling of vacancies. Furthermore, there was an increase in professional and special services ($0.6M) due mainly to additional costs for legal contracts as well as consultant fees for digital transformation projects.
The TSB’s revenues are incidental and result from cost recovery activities from training or investigation activities, proceeds from the disposal of surplus assets, and fees generated by requests under the Access to Information Act.
Condensed Statement of Financial Position (unaudited) as of March 31, 2020 (dollars)
| Financial information | 2019–20 | 2018–19 | Difference (2019–20 minus 2018–19) |
|---|---|---|---|
| Total net liabilities | 8,110 | 7,033 | 1,077 |
| Total net financial assets | 4,633 | 3,691 | 942 |
| Departmental net debt | 3,477 | 3,342 | 135 |
| Total non-financial assets | 4,870 | 5,085 | (215) |
| Departmental net financial position | 1,393 | 1,743 | (350) |
The TSB’s total net liabilities consist primarily of accounts payable and accrued liabilities relating to operations which account for $5.0M and 62% (60% in 2018-19) of total liabilities. The liability for employee future benefits pertaining to severance pay represents $1.1M and 14% (15% in 2018-19) of total liabilities, while the liability for vacation pay and compensatory leave accumulated by employees but not taken at year-end represents $2.0M and 25% (25% in 2018-19). The increase in net liabilities between years is primarily attributed to accounts payable and accrued liabilities for amounts owed to employees for large retroactive salary amounts at year-end as well as an increase in provision for vacation pay and compensatory leave.
Total net financial assets consist of accounts receivable, advances, and amounts due from the Consolidated Revenue Fund (CRF) of the Government of Canada. The amount due from the CRF represents 93% or $4.3M (95% in 2018-19) of the year-end balance, an increase of $0.8M. This represents an increase in the amount of net cash that the TSB is entitled to draw from the CRF in the future to discharge its current liabilities without further appropriations. The TSB’s total net financial assets have increased by $0.9M between years mainly due to the higher amount due from the CRF.
Total non-financial assets consist primarily of tangible capital assets, which make up $4.7M or 97% of the balance (97% in 2018-19), with inventory and prepaid expenses accounting for the remainder. The decrease of $0.2M in non-financial assets between years is due to the annual amortization and write off of assets ($1.2M) which is offset by the acquisition of new assets ($1.0M).
Additional information
Organizational profile
Appropriate minister: The Honourable Dominic LeBlanc
Institutional head: Kathleen Fox
Ministerial portfolio: Privy Council
Enabling instrument: Canadian Transportation Accident Investigation and Safety Board Act,Footnote iv S.C. 1989, c. 3
Year of incorporation / commencement: 1990
Raison d’être, mandate and role: who we are and what we do
“Raison d’être, mandate and role: who we are and what we do” is available on the TSB website.Footnote v
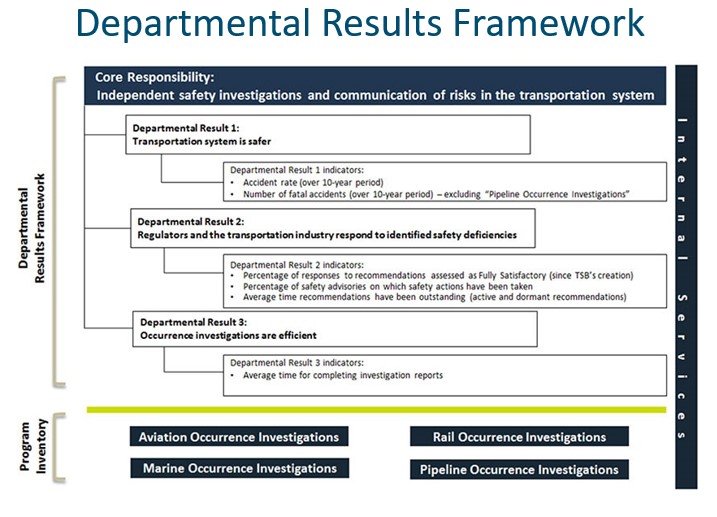
Reporting framework
TSB’s Departmental Results Framework and Program Inventory of record for 2019–20 are shown below.
Supporting information on the program inventory
Financial, human resources and performance information for TSB’s Program Inventory is available in GC InfoBase.Footnote vi
Supplementary information tables
The following supplementary information tables are available on TSB website.Footnote vii
- Departmental Sustainable Development Strategy
- Gender-based analysis plus
Organizational contact information
Additional information about the Transportation Safety Board of Canada and its activities is available on the TSB websiteFootnote viii or by contacting us at:
Transportation Safety Board of Canada
Place du Centre
200 Promenade du Portage, 4th Floor
Gatineau, Quebec K1A 1K8
E-mail: Communications@bst-tsb.gc.ca
Social media:
Toll Free: 1-800-387-3557
Appendix: definitions
appropriation (crédit)
Any authority of Parliament to pay money out of the Consolidated Revenue Fund.
budgetary expenditures (dépenses budgétaires)
Operating and capital expenditures; transfer payments to other levels of government, organizations or individuals; and payments to Crown corporations.
core responsibility (responsabilité essentielle)
An enduring function or role performed by a department. The intentions of the department with respect to a core responsibility are reflected in one or more related departmental results that the department seeks to contribute to or influence.
Departmental Plan (plan ministériel)
A report on the plans and expected performance of an appropriated department over a 3‑year period. Departmental Plans are usually tabled in Parliament each spring.
departmental priority (priorité)
A plan or project that a department has chosen to focus and report on during the planning period. Priorities represent the things that are most important or what must be done first to support the achievement of the desired departmental results.
departmental result (résultat ministériel)
A consequence or outcome that a department seeks to achieve. A departmental result is often outside departments’ immediate control, but it should be influenced by program-level outcomes.
departmental result indicator (indicateur de résultat ministériel)
A quantitative measure of progress on a departmental result.
departmental results framework (cadre ministériel des résultats)
A framework that connects the department’s core responsibilities to its departmental results and departmental result indicators.
Departmental Results Report (rapport sur les résultats ministériels)
A report on a department’s actual accomplishments against the plans, priorities and expected results set out in the corresponding Departmental Plan.
experimentation (expérimentation)
The conducting of activities that seek to first explore, then test and compare the effects and impacts of policies and interventions in order to inform evidence-based decision-making, and improve outcomes for Canadians, by learning what works, for whom and in what circumstances. Experimentation is related to, but distinct from innovation (the trying of new things), because it involves a rigorous comparison of results. For example, using a new website to communicate with Canadians can be an innovation; systematically testing the new website against existing outreach tools or an old website to see which one leads to more engagement, is experimentation.
full‑time equivalent (équivalent temps plein)
A measure of the extent to which an employee represents a full person‑year charge against a departmental budget. For a particular position, the full‑time equivalent figure is the ratio of number of hours the person actually works divided by the standard number of hours set out in the person’s collective agreement.
gender-based analysis plus (GBA+) (analyse comparative entre les sexes plus [ACS+])
An analytical process used to assess how diverse groups of women, men and gender-diverse people experience policies, programs and services based on multiple factors including race ethnicity, religion, age, and mental or physical disability.
government-wide priorities (priorités pangouvernementales)
For the purpose of the 2019–20 Departmental Results Report, those high-level themes outlining the government’s agenda in the 2019 Speech from the Throne, namely: Fighting climate change; Strengthening the Middle Class; Walking the road of reconciliation; Keeping Canadians safe and healthy; and Positioning Canada for success in an uncertain world.
horizontal initiative (initiative horizontale)
An initiative where two or more federal organizations are given funding to pursue a shared outcome, often linked to a government priority.
non‑budgetary expenditures (dépenses non budgétaires)
Net outlays and receipts related to loans, investments and advances, which change the composition of the financial assets of the Government of Canada.
performance (rendement)
What an organization did with its resources to achieve its results, how well those results compare to what the organization intended to achieve, and how well lessons learned have been identified.
performance indicator (indicateur de rendement)
A qualitative or quantitative means of measuring an output or outcome, with the intention of gauging the performance of an organization, program, policy or initiative respecting expected results.
performance reporting (production de rapports sur le rendement)
The process of communicating evidence‑based performance information. Performance reporting supports decision making, accountability and transparency.
plan (plan)
The articulation of strategic choices, which provides information on how an organization intends to achieve its priorities and associated results. Generally, a plan will explain the logic behind the strategies chosen and tend to focus on actions that lead to the expected result.
planned spending (dépenses prévues)
For Departmental Plans and Departmental Results Reports, planned spending refers to those amounts presented in Main Estimates.
A department is expected to be aware of the authorities that it has sought and received. The determination of planned spending is a departmental responsibility, and departments must be able to defend the expenditure and accrual numbers presented in their Departmental Plans and Departmental Results Reports.
program (programme)
Individual or groups of services, activities or combinations thereof that are managed together within the department and focus on a specific set of outputs, outcomes or service levels.
program inventory (répertoire des programmes)
Identifies all the department’s programs and describes how resources are organized to contribute to the department’s core responsibilities and results.
result (résultat)
A consequence attributed, in part, to an organization, policy, program or initiative. Results are not within the control of a single organization, policy, program or initiative; instead they are within the area of the organization’s influence.
statutory expenditures (dépenses législatives)
Expenditures that Parliament has approved through legislation other than appropriation acts. The legislation sets out the purpose of the expenditures and the terms and conditions under which they may be made.
target (cible)
A measurable performance or success level that an organization, program or initiative plans to achieve within a specified time period. Targets can be either quantitative or qualitative.
voted expenditures (dépenses votées)
Expenditures that Parliament approves annually through an appropriation act. The vote wording becomes the governing conditions under which these expenditures may be made.