This document is a summary of selected 2015 aviation safety data.
The TSB gathers and uses this data during the course of its investigations to analyse safety deficiencies and identify risks in the Canadian transportation system.
The 2015 data were collected according to the reporting requirements described in the TSB Regulations in force during that calendar year.
The statistics presented here reflect the TSB database at 17 February 2016. Since the occurrence data are constantly being updated in the live database, the statistics may change slightly over time.
Because many occurrences are not formally investigated, information recorded on some occurrences may not have been verified. Consequently, be cautious in using these statistics.
See the data tables associated with this summary.
Accidents
Overview of accidents and fatalities
In 2015, a total of 251 aviation accidents were reported to the TSB, comparable to the previous year’s total of 249 and an 8% decrease from the 5-year average of 272. Of the total, 227 involved Canadian-registered aircraft (excluding ultra-lights)Footnote 1, a 7% increase from the previous year’s total of 212 (Figure 1), but a 3% decrease from the 5-year average of 234.
The 2015 estimate of flying activity is 4,353,000 hoursFootnote 2, and the accident rate for Canadian-registered aircraft was 5.1 accidents per 100 000 flying hours, an increase from the previous year’s accident rate of 4.8. Analysis using linear regression indicates a statistically significant downward trend in accident rates (p < .001)Footnote 3 over the 10-year period from 2006 to 2015 (Figure 1). Similarly, the 2015 accident rate of 3.7 accidents per 100 000 aircraft movements increased from the 2014 rate of 3.5 accidents per 100 000 aircraft movements, although that rate has also trended significantly downward (p < .05) over the same 10-year period.
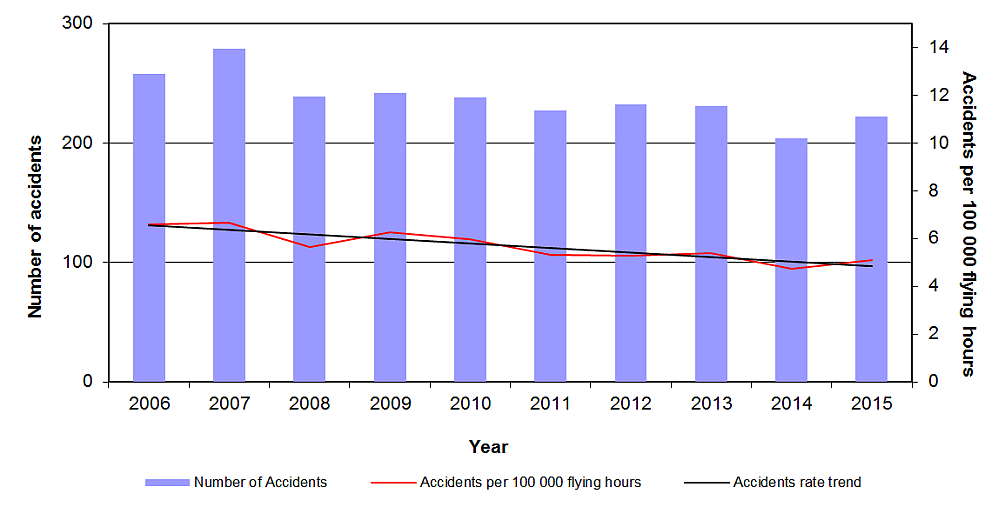
Figure 1 data table
| Year | Number of accidents | Accidents per 100,000 flying hours |
|---|---|---|
| 2006 | 258 | 6.6583312069 |
| 2007 | 279 | 6.647605432 |
| 2008 | 239 | 5.635463334 |
| 2009 | 242 | 6.261319534 |
| 2010 | 238 | 5.966407621 |
| 2011 | 227 | 5.30994152 |
| 2012 | 232 | 5.287146764 |
| 2013 | 231 | 5.390898483 |
| 2014 | 204 | 4.750815091 |
| 2015 | 222 | 5.099931082 |
The 227 accidents involving Canadian-registered aircraft (Figure 2), included 189 accidents involving aeroplanesFootnote 4 (50 accidents involved commercially operated aeroplanes) and 33 accidents involving helicopters. The remaining seven accidents involved 5 gliders, 1 gyroplanes, and 1 powered hang-glider with an inflatable boat hull.
Of the 50 accidents involving 52 Canadian-registered commercially operated aeroplanes (8 airliners, 3 commuter aircraft, 12 air taxi, 10 aerial work, 18 flight training and 1 unknown) in 2015, 6 resulted in a total of 13 fatalities (Table 4). Three fatal accidents involved air taxis, 2 involved aerial work, and 1 involved flight training.
A total of 139 accidents involved Canadian-registered private/other aeroplanes, 2% lower than the 5-year average of 142. In 2015, 13 such accidents resulted in fatalities, up from 8 in 2014, but down slightly from the 5-year average of 14.
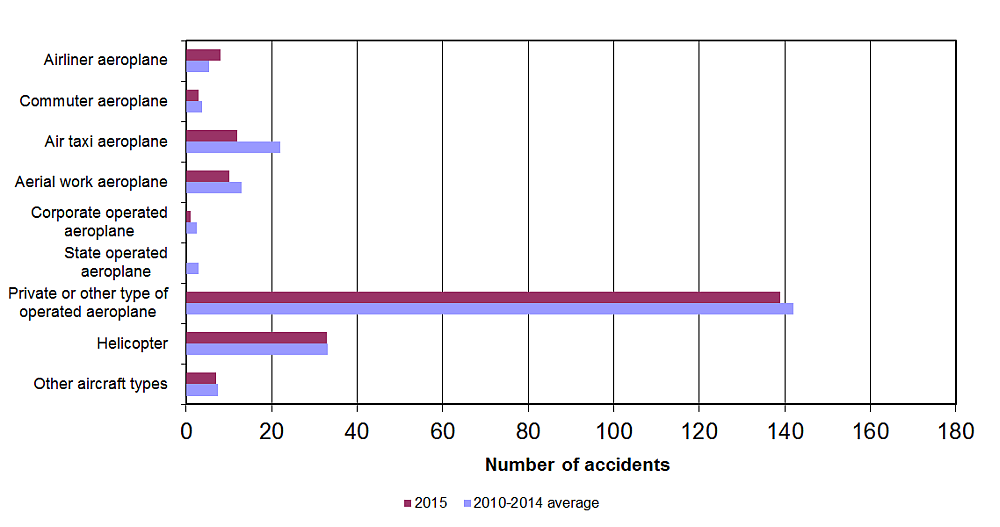
Figure 2 data table
| Aircraft type | 2010-2014 average | 2015 |
|---|---|---|
| Other aircraft types | 7 | 7 |
| Helicopter | 33 | 33 |
| Private or other type of operated aeroplane | 142 | 139 |
| State operated aeroplane | 3 | 0 |
| corporate operated aeroplane | 2 | 1 |
| aerial work aeroplane | 13 | 10 |
| air taxi aeroplane | 22 | 12 |
| commuter aeroplane | 4 | 3 |
| airliner aeroplane | 5 | 8 |
In 2015, 23 fatal accidents involved Canadian-registered aircraft other than ultra-lights (Figure 3), up substantially from the 2014 total of 10, but down from the 5-year average of 27.
The number of fatalities (40), was substantially higher than the 2014 total of 15, but lower than the 5-year average of 51. The number of serious injuries (28) was slightly lower than the 2014 total of 29 and the 5-year average of 32.
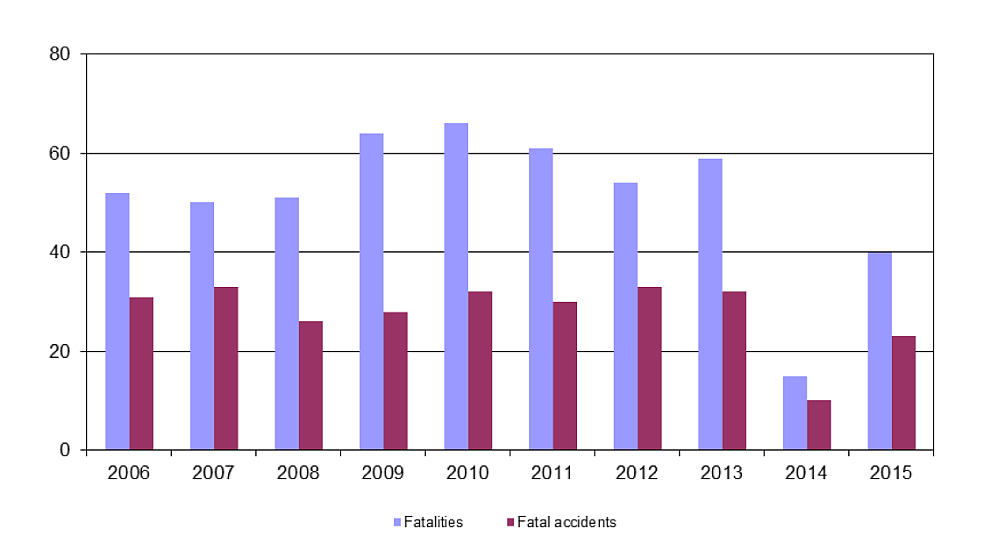
Figure 3 data table
| Year | Fatalities | Fatal accidents |
|---|---|---|
| 2006 | 52 | 31 |
| 2007 | 50 | 33 |
| 2008 | 51 | 26 |
| 2009 | 64 | 28 |
| 2010 | 66 | 32 |
| 2011 | 61 | 30 |
| 2012 | 54 | 33 |
| 2013 | 59 | 32 |
| 2014 | 15 | 10 |
| 2015 | 40 | 23 |
In 2015, crew fatalities accounted for 62% of aircraft fatalities, and passenger fatalities accounted for 38%.
In 2015, 33 accidents involved Canadian-registered helicopters, unchanged from the 5-year average of 33. Five of these accidents were fatal, resulting in a total of 8 fatalities. Over the past 10 years, the highest proportion of helicopter accidents occurred during air transport operations (40%), pleasure/travel (16%), and training (7%).
In 2015, 16 accidents in Canada involved Canadian-registered ultra-light aircraft, a 42% decrease from the 5-year average of 27. Three of these were fatal accidents resulting in 3 fatalities in total.
In 2015, 9 accidents involved foreign-registered aircraft in Canada, with 3 fatal accidents resulting in a total of 4 fatalities.
Accidents by selected categories
Operation type
In 2015, aeroplane accidents occurred mainly on recreational flights (66%), air transport flights (11%), and training (8%). Helicopter accidents occurred mainly on air transport flights (30%), recreational flights (24%), and training (15%).
Province
In 2015, the total number of Canadian-registered aircraft accidents was slightly lower than the 5-year average for most provinces (Figure 4). Ontario accounted for 29% of Canadian-registered aircraft accidents and incurred a 19% increase from its 5-year average, and Quebec accounted for 19% of Canadian registered aircraft accidents with a 19% decrease from its 5-year average. Alberta accounted for 18%, with 1 more accident than its 5-year average. These accidents were approximately proportional to the number of registered aircraft in those provincesFootnote 5.
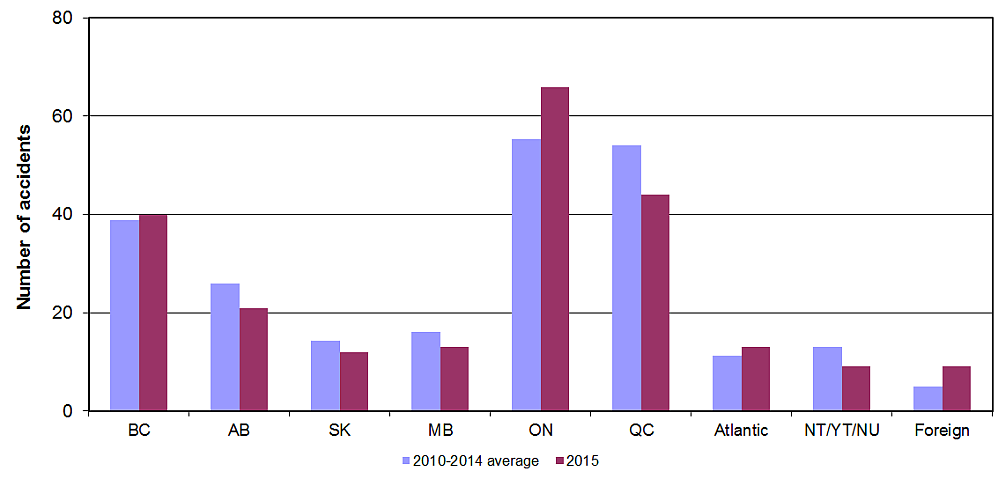
Figure 4 data table
| Province | 2010-2014 average | 2015 |
|---|---|---|
| B.C. | 39 | 40 |
| ALB | 26 | 21 |
| SASK | 14 | 12 |
| MAN | 16 | 13 |
| ONT | 55 | 66 |
| QUE | 54 | 44 |
| ATL | 11 | 13 |
| NWT/YK/NT | 13 | 9 |
| FOREIGN | 5 | 9 |
Accident Events and Phases
Accidents may be analyzed in more detail by examining the nature and distribution of selected events contributing to an occurrence.
Although a single accident may involve more than one event within a phase, that accident is only counted once in the phase total. Therefore, the total of events within a phase will not sum to phase event totals. For example, in the takeoff phase, if an occurrence involves both loss of control and power loss events, the occurrence is counted in each event category, but only once in the phase total. As well, approximately 25% of aeroplane accidents and 15% of helicopter accidents involve events in more than one phase of flight (not including the post-impact phase), so the accidents shown in Figure 5 and Figure 6 sum to more than the total of accidents.
Aeroplane
In 2015, the distribution was similar to that of 2014. The greatest numbers of aeroplane accidents were associated with landing (59%) and takeoff (26%) phases of flight, followed by the en route (14%) and approach (12%) phases. The greatest numbers of helicopter accidents were associated with the landing (53%), manoeuveringFootnote 6 (24%), takeoff (12%), and en route (12%) phases of flight. The figures below show the distribution of accidents per phase of flight for the period 2006 to 2015.
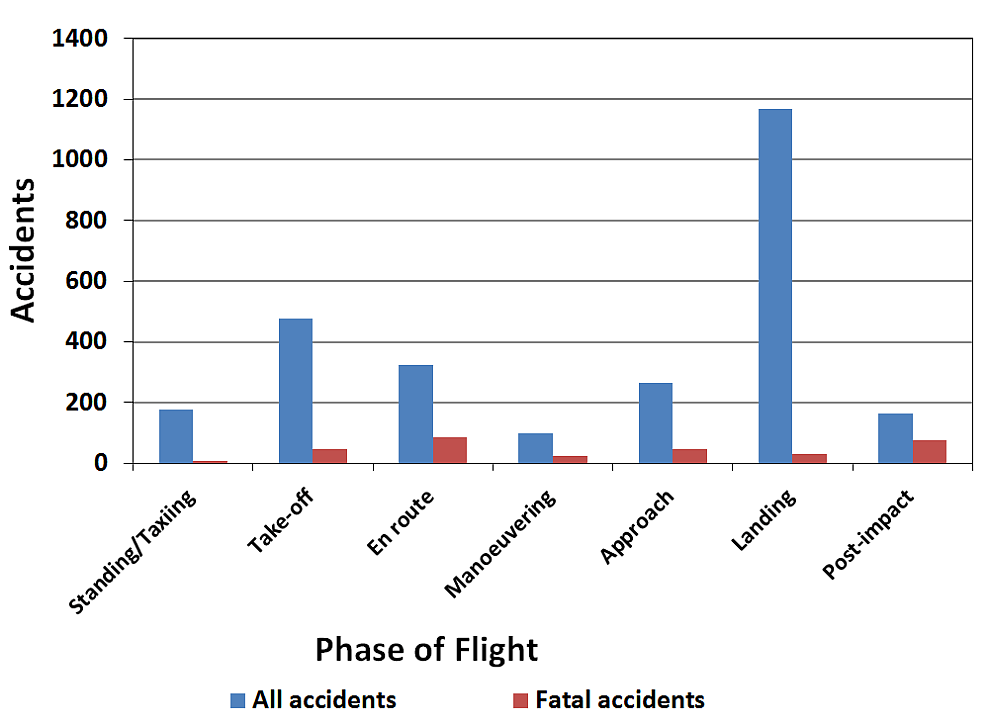
Figure 5 data table
| Event phase of flight | All accidents | Fatal accidents |
|---|---|---|
| Standing/Taxiing | 178 | 6 |
| Take-off | 478 | 47 |
| En route | 324 | 84 |
| Manoeuvering | 98 | 25 |
| Approach | 266 | 47 |
| Landing | 1169 | 31 |
| Post-impact | 165 | 76 |
From 2006 to 2015, of the 1169 aeroplane accidents with landing phase events, 22% involved collision with object, 20% involved missing or going off the runway, 20% involved landing gear collapse or retraction, and 18% involved a nosedown or overturning event. Of the 478 aeroplane accidents with take-off phase events, 29% involved collision with terrain, 29% involved collision with object, and 26% involved loss of control.
Collision with terrain was the predominant event in fatal aeroplane accidents from 2006 to 2015. Collision with terrain was involved in 55% of the 47 fatal aeroplane accidents with takeoff phase events, 70% of 84 fatal aeroplane accidents with en route phase events, 76% of 25 fatal aeroplane accidents with manoeuvering phase events, 66% of 47 fatal aeroplane accidents with approach phase events, and 48% of 31 fatal aeroplane accidents with landing phase events.
Helicopter
From 2006 to 2015, of the 146 helicopter accidents with landing phase events, 27% involved a hard landing, 25% involved a collision with object, 23% involved collision with terrain, and 20% involved loss of control. Of the 90 helicopter accidents with manoeuvering phase events, 46% involved collision with terrain, 28% involved loss of control, and 26% involved collision with object.
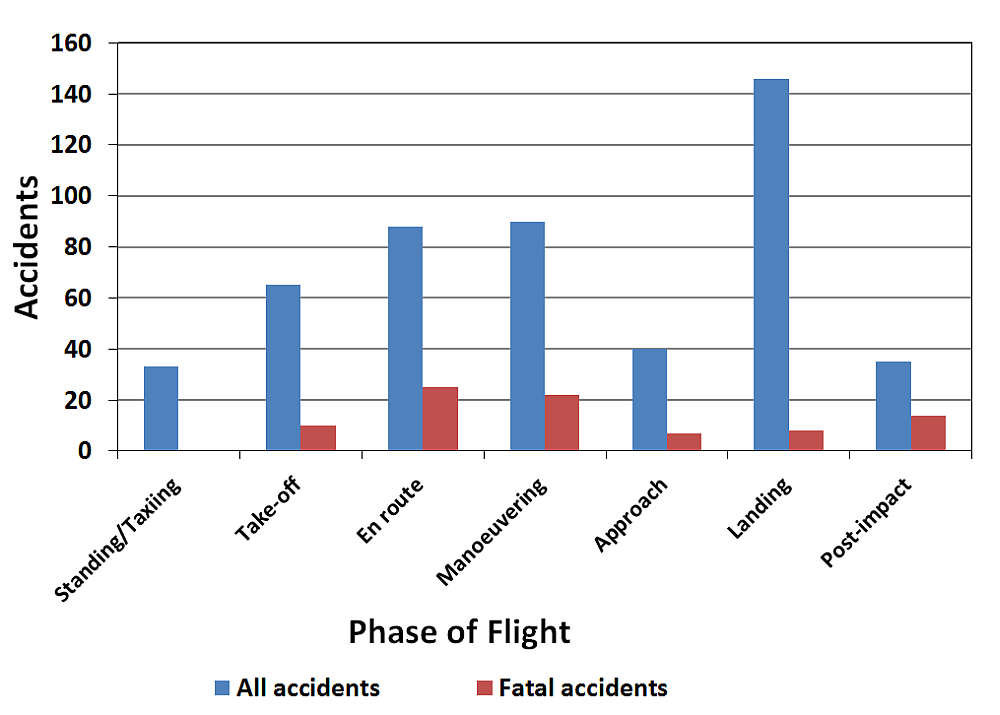
Figure 6 data table
| Event phase of flight | All accidents | Fatal accidents |
|---|---|---|
| Standing/Taxiing | 33 | 0 |
| Take-off | 65 | 10 |
| En route | 88 | 25 |
| Manoeuvering | 90 | 22 |
| Approach | 40 | 7 |
| Landing | 146 | 8 |
| Post-impact | 35 | 14 |
Collision with terrain was also the predominant event in fatal helicopter accidents from 2006 to 2015. Collision with terrain was involved in 8 of 10 fatal helicopter accidents with takeoff phase events, 19 of 25 fatal helicopter accidents with en route phase events, 15 of 22 fatal helicopter accidents with manoeuvering phase events, 3 of 7 fatal helicopter accidents with approach phase events, and 6 of 8 fatal helicopter accidents with landing phase events.
Incidents
Overview of Incidents
Pursuant to TSB mandatory incident reporting requirements, 789 incidents were reported in 2015, with 711 involving Canadian-registered aircraft. This is a 9% increase from the 2014 total of 654, and an 18% increase from the 5-year average of 601. On March 12, 2014, the TSB issued new regulations that changed the reporting requirements effective July 1, 2014. Under the new reporting requirements aviation incidents include aircraft having a maximum certificated take-off weight greater than 2 250 kg (formerly 5700 kg) and aircraft being operated under an air operator certificate issued under CARS Part VII. The increase in incidents in 2014 and 2015 is consistent with this change.
In 2015, the most frequent incident types involving all Canadian-registered and foreign-registered aircraft were declared emergency (42%), engine failure, (14%), and risk of collision or loss of separation (14%) (Figure 7).
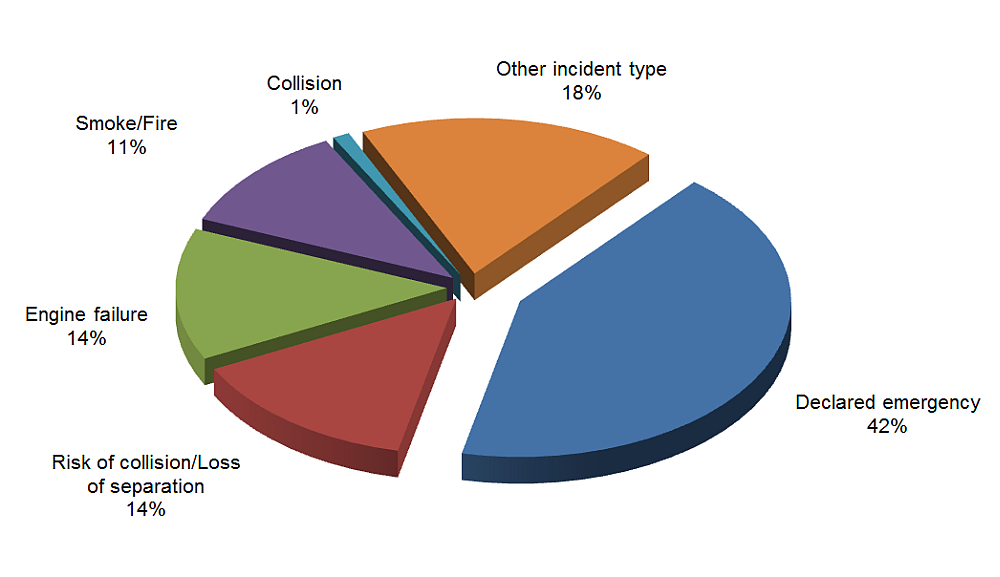
Figure 6 data table
| Reportable incident type | Number | Percentage (%) |
|---|---|---|
| Declared emergency | 334 | 42 |
| Risk of collision/Loss of separation | 111 | 14 |
| Engine failure | 108 | 14 |
| Smoke/Fire | 87 | 11 |
| Collision | 8 | 1 |
| Other incident type | 141 | 18 |
Definitions
The following definitions apply to aviation occurrences that are required to be reported pursuant to the Canadian Transportation Accident Investigation and Safety Board Act and the TSB regulations.
Aviation occurrence
- Any accident or incident associated with the operation of an aircraft, and
- Any situation or condition that the Board has reasonable grounds to believe could, if left unattended, induce an accident or incident described above.
Reportable aviation accident
An accident resulting directly from the operation of an aircraft where:
- a person is killed or sustains a serious injury as a result of:
- being on board the aircraft,
- coming into contact with any part of the r aircraft, including parts that have become detached from the aircraft, or
- being directly exposed to jet blast, rotor down wash or propeller wash,
- the aircraft sustains structural failure or damage that adversely affects the aircraft’s structural strength, performance or flight characteristics and would normally require major repair or replacement of any affected component, except for
- engine failure or damage, when the damage is limited to the engine, its cowlings or accessories, or
- damage limited to propellers, wing tips, antennae, tires, brakes, fairings or small dents or puncture holes in the aircraft’s skin, or
- the aircraft is missing or inaccessible;
Reportable aviation incident
An incident involving an aircraft having a maximum certificated take-off weight greater than 2 250 kg, or of an aircraft being operated under an air operator certificate issued under Part VII of the Canadian Aviation Regulations, where:
- an engine fails or is shut down as a precautionary measure,
- a power train transmission gearbox malfunction occurs,
- smoke is detected or a fire occurs on board,
- difficulties in controlling the aircraft are encountered owing to any aircraft system malfunction, weather phenomena, wake turbulence, uncontrolled vibrations or operations outside the flight envelope
- the aircraft fails to remain within the intended landing or take-off area, lands with all or part of the landing gear retracted or drags a wing tip, an engine pod or any other part of the aircraft,
- a crew member whose duties are directly related to the safe operation of the aircraft is unable to perform their duties as a result of a physical incapacitation which poses a threat to the safety of persons, property or the environment,
- depressurization of the aircraft occurs that requires an emergency descent,
- a fuel shortage occurs that requires a diversion or requires approach and landing priority at the destination of the aircraft,
- the aircraft is refuelled with the incorrect type of fuel or contaminated fuel,
- a collision, a risk of collision or a loss of separation occurs,
- a crew member declares an emergency or indicates an emergency that requires priority handling by air traffic services or the standing by of emergency response services,
- a slung load is released unintentionally or as a precautionary or emergency measure from the aircraft, or
- any dangerous goods are released in or from the aircraft.
Collision
Collision means an impact, other than an impact associated with normal operating circumstances, between aircraft or between an aircraft and another object or terrain.
Risk of collision
Risk of collision means a situation in which an aircraft comes so close to being involved in a collision that a threat to the safety of any person, property or the environment exists.
Loss of separation
Loss of separation means a situation in which the distance separating two aircraft is less than the minimum established in the Canadian Domestic Air Traffic Control Separation Standards, published by the Department of Transport, as amended from time to time.
Serious injury
- a fracture of any bone, except simple fractures of fingers, toes or the nose,
- lacerations that cause severe hemorrhage or nerve, muscle or tendon damage,
- an injury to an internal organ,
- second or third degree burns, or any burns affecting more than 5% of the body surface,
- a verified exposure to infectious substances or injurious radiation, or
- an injury that is likely to require hospitalization.
ATS-Related Event
Any event related to the provision of air traffic control services including, but not limited to, failure or inability to provide service, emergency handling, or loss of in-flight separation.
Air Proximity Event
A situation in which, in the opinion of a pilot or air traffic services personnel, the distance between aircraft as well as their positions and speed have been such that the safety of the aircraft involved may have been compromised.
Operation
Operation means the activities for which an aircraft is used from the time any person boards the aircraft with the intention of flight until they disembark.
Operator
Operator has the same meaning as in subsection 101.01(1) of the Canadian Aviation Regulations.
Commercial Operators
Commercial operators include carriers that offer a “for-hire” service to transport people or goods, or to undertake specific tasks such as aerial photography, flight training, or crop spraying.
Airliner
An aeroplane used by a Canadian air operator in an air transport service or in aerial work involving sightseeing operations, that has a MCTOW of more than 8618 kg (19 000 pounds) or for which a Canadian type certificate has been issued authorizing the transport of 20 or more passengers.
Commuter Aircraft
An aeroplane used by a Canadian air operator, in an air transport service or in aerial work involving sightseeing operations, in which the aircraft is:
- a multi engined aircraft that has a MCTOW of 8618 kg (19 000 pounds) or less and a seating configuration, excluding pilot seats, of 10 to 19 inclusive;
- a turbo jet powered aeroplane that has a maximum zero fuel weight of 22 680 kg (50 000 pounds) or less and for which a Canadian type certificate has been issued authorizing the transport of not more than 19 passengers.
Aerial Work Aircraft
A commercially operated aeroplane or helicopter used in aerial work involving
- the carriage on board of persons other than flight crew members,
- the carriage of helicopter external loads,
- the towing of objects, or
- the dispersal of products.
Air Taxi Aircraft
A commercially operated aircraft used in an air transport service or in aerial work involving sightseeing operations, in which the aircraft is:
- a single engined aircraft;
- a multi engined aircraft, other than a turbo jet powered aeroplane, that has a MCTOW of 8618 kg (19 000 pounds) or less and a seating configuration, excluding pilot seats, of nine or less; or
- any aircraft that is authorized by the Minister of Transport to be operated under Part VII, Subpart 3, Division 1 of the Canadian Aviation Regulations (CARs).
State Operators
State operators include the federal and provincial governments.
Corporate Operators
Corporate operators include companies flying for business reasons.
Private Operators
Private operators include individuals flying for pleasure. Included are flights on which it is not possible to transport people or cargo on a “for-hire” basis.