Table of contents
1.0 Introduction
1.1 Description of occurrence
1.1.1
On 06 July 2013, shortly before 0100 Eastern Daylight Time, eastward Montreal, Maine & Atlantic Railway freight train No. 2, which had been parked unattended for the night at Nantes, Quebec, started to roll uncontrolled. The train travelled a distance of about 7.2 miles, reaching a speed of 65 mph. At about 0115, while approaching the centre of the town of Lac-Mégantic, Quebec, 63 tank cars carrying petroleum crude oil, UN 1267, and 2 box cars derailed. As a result of the derailment, about 6 million litres of petroleum crude oil spilled. There were fires and explosions, which destroyed 40 buildings, 50 vehicles and the railway tracks at the west end of Megantic Yard. A total of 47 people were fatally injured.
1.1.2
Preliminary examination of the derailment site determined that a buffer box car, CIBX 172032, immediately behind the locomotive consist, and the following 63 loaded tank cars derailed on the main track of a 4.25° right-hand curve in the direction of travel (eastward), covering a No. 11 turnout. The locomotive consist separated from the derailed cars and split into 2 portions, with each travelling different distances before they came to a stop. After a significant time, the front portion of the locomotive consist moved backward (westward) and collided with the second portion, both moving a short distance further (westward) and coming to a final stop together.
1.1.3
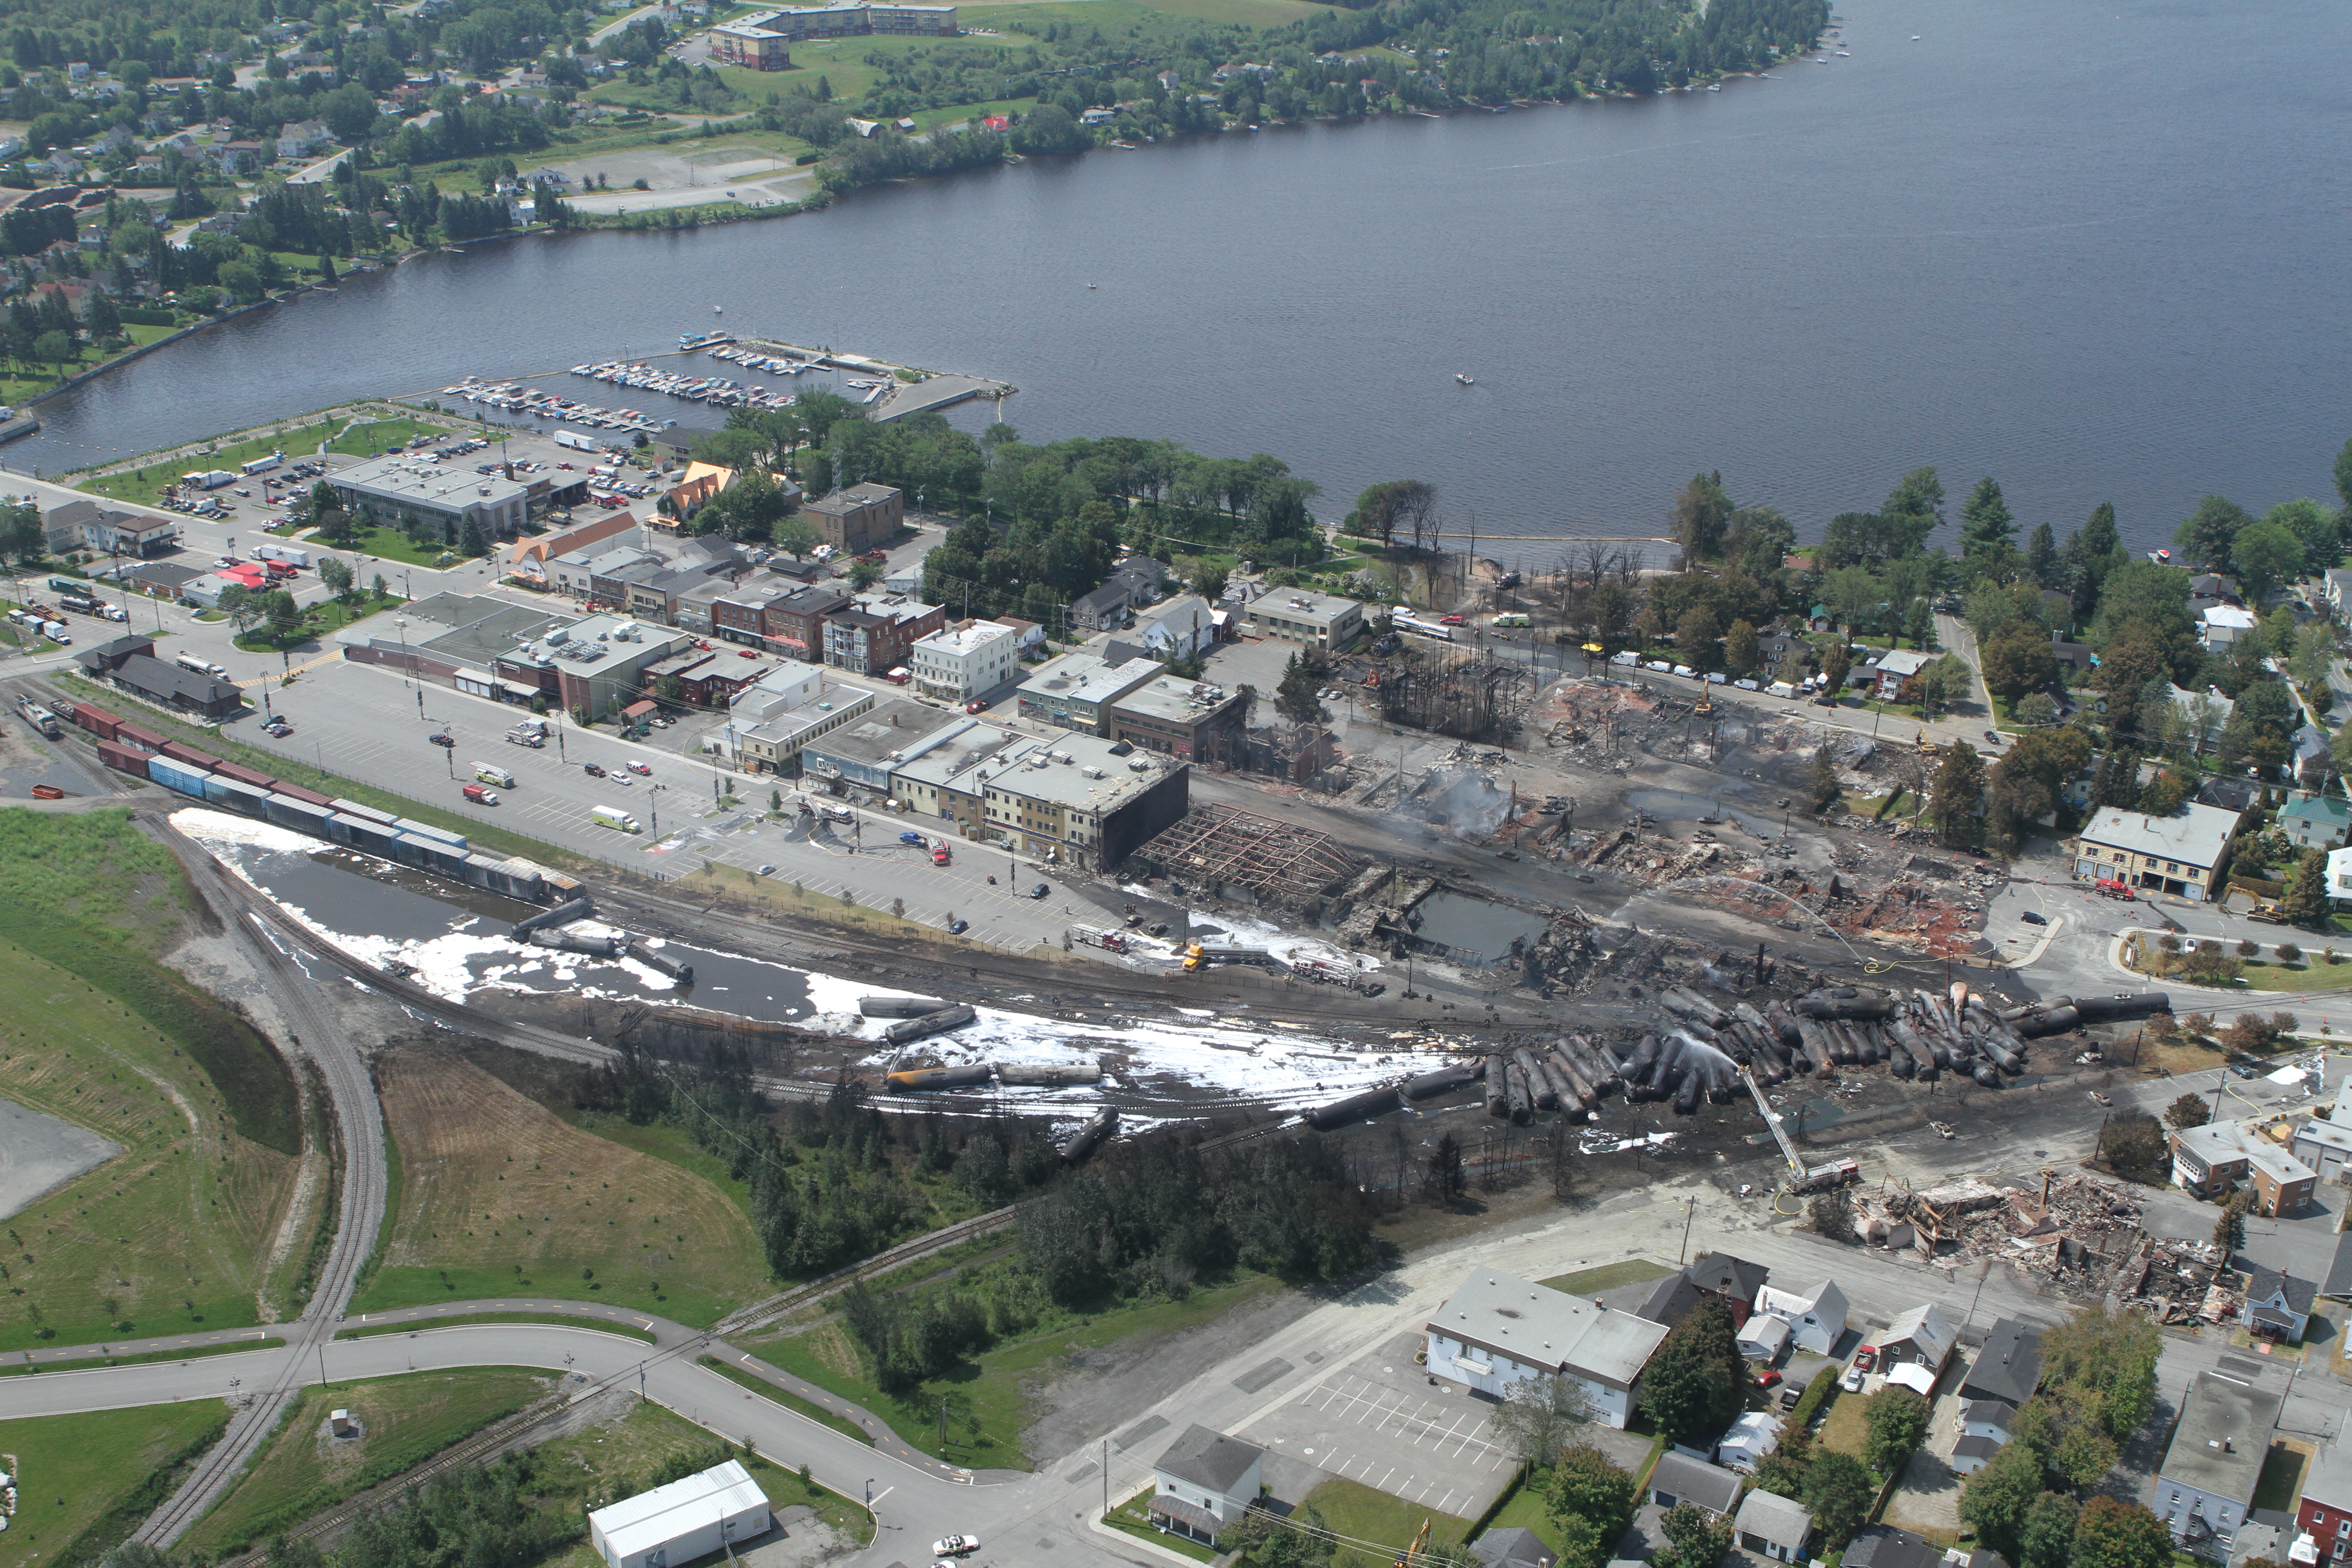
The derailed buffer box car struck a stationary cut of cars on the siding track. The following 8 tank cars were scattered in separated jackknifed positions. The next 2 tank cars lay in the direction of the turnout siding, ahead of the main jackknifed pile-up of the rest of the derailed tank cars among which the fire and explosions occurred. The last 9 tank cars in the train did not derail. They were disconnected and removed back and away from the derailment and fire by the locomotive engineer and emergency responders. An aerial-view photograph of the accident site is shown in Figure 1.
1.2 Background
1.2.1
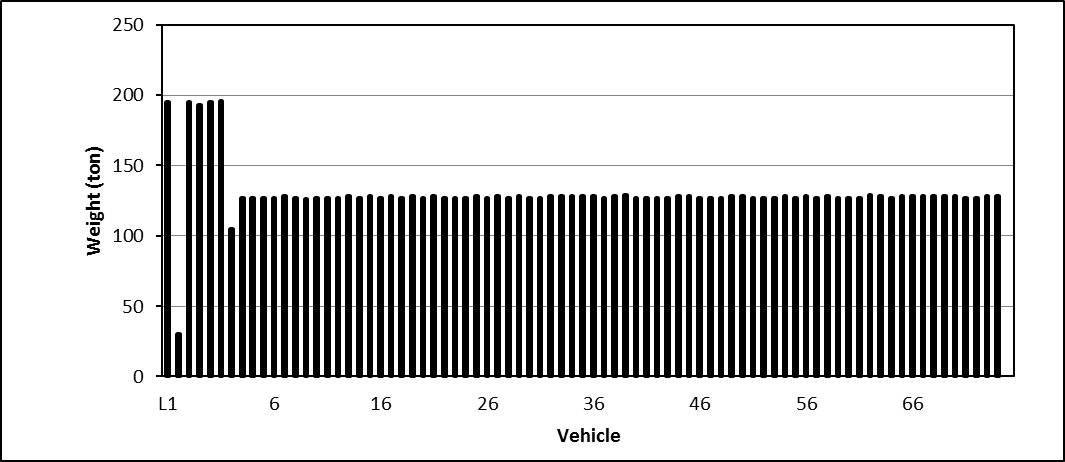
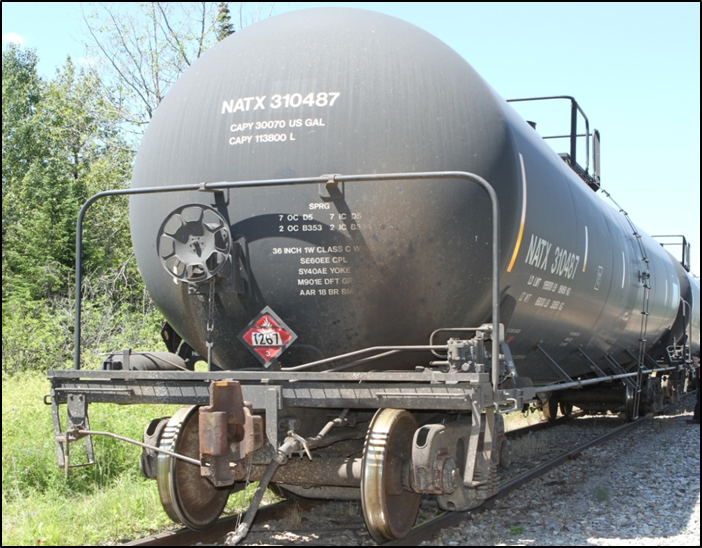
Train MMA-002 consisted of 5 locomotives, 1 operation control car VB-1, 1 loaded buffer box car, and 72 tank cars loaded with petroleum crude oil. The train weighed 10 287 tons and was 4701 feet long. The train weight profile is shown in Figure 2.
1.2.2
The train was operated by a 1-person crew. Before midnight, it came to a stop on the main track of Station Nantes with an automatic application of the air brakes. The locomotive engineer applied hand brakes on the locomotive consist and the buffer car, and then released the automatic brake, but kept the independent brake (IND) of the locomotive consist in the applied position. The engine of the lead locomotive, MMA 5017, was kept running at idle to maintain the air brake supply. The locomotive engineer left the train and went to a hotel for rest, as indicated in his schedule.
1.2.3
A fire was detected on the lead locomotive sometime after the locomotive engineer left (LP181/2013). Local firefighters came and put out the fire. A local MMA engineering employee was called to attend to the fire site. The engine of the locomotive was shut down, and the train was left unattended again. Approximately 59 minutes later, the train started to move down the descending grades, and accelerated all the way until it reached the town of Lac-Mégantic, where it derailed.
1.2.4
The lead locomotive, MMA 5017, was equipped with a Quantum Engineering Incorporated (QEI) locomotive event recorder (LER) version no. S45E, serial no. 0204100033. The recorded data in the “extend log” was downloaded from MMA 5017 by a MMA staff member soon after the accident and provided to the TSB.
1.2.5
The train was also equipped with an end-of-train (EOT) sense and brake unit (SBU). The SBU was sent to the TSB Engineering Laboratory for examination (LP 132/2013). The records in the DataFlash were extracted and converted into Excel spreadsheets. The EOT SBU download data were provided for a comprehensive analysis of LER and SBU data together.
1.2.6
The TSB investigation team also obtained a copy of the standard report of the public crossing at Mile 117.11, Moosehead Subdivision, that indicated the activation of the crossing signal and protection. The time record was calibrated by an independent crossing company. This record was used as a reference in the synchronization and calibration of the downloaded LER time records. The comprehensive analysis of the downloaded LER records, SBU data and the standard report of the public crossing at Mile 117.11was conducted and a number of significant events of interest were identified to assist the investigation (LP136/2013).
1.3 Engineering services requested
1.3.1
The LER data analysis and the on-site investigation determined that a few minutes after the engine of the lead locomotive MMA 5017 was shut down, the brake pipe pressure (BP) began to decrease at an average rate of about 1 psi per minute. Eight minutes later, the independent brake cylinder pressure (BC) began to decrease at the same rate as the brake pipe pressure.
1.3.2
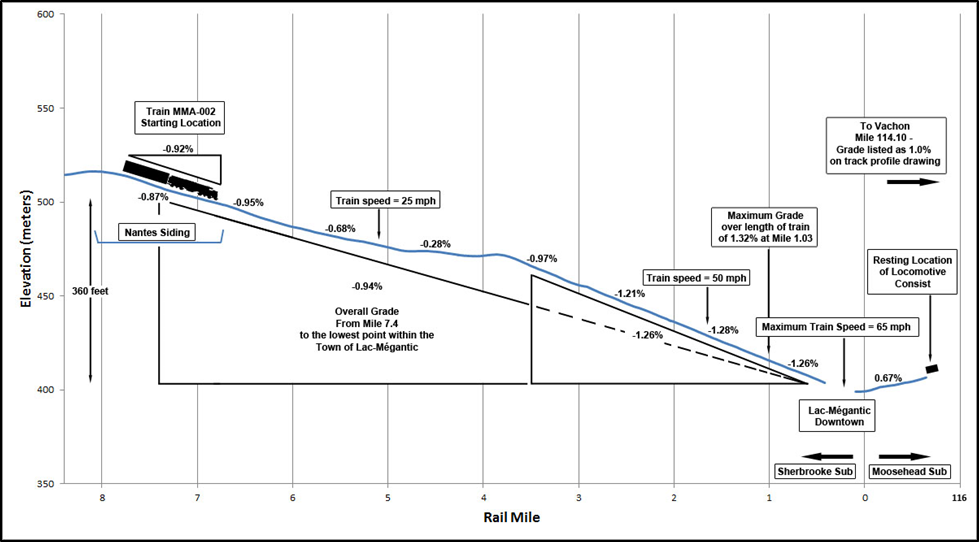
MMA-002 began to run away at 0058:21 when the BP dropped to 32 psi and the IND BC dropped to 27 psi. The on-site survey determined that the train was located on an average descending grade of 0.92% as shown in Figure 3. The actual brake forces on the occurrence train at this moment became one of the critical issues to be investigated.
1.3.3
The TSB investigation team conducted a number of tests to determine the actual state of the brake system, including the tests on the surviving locomotive consist and tank cars, simulation test on a similar sister train, examination of the brake air valves and wheel blueing, and an extra test of hand brake upon air brake on other cars. The historical tests that TSB did in previous investigations were also reviewed and used in this investigation. The TSB Engineering Laboratory was requested to participate in conducting tests and analyzing the brake forces.
1.3.4
This lab project covers three of the tests, i.e. the test on the locomotive consist at Vachon, the test on the surviving tank cars at Farnham, and the extra test of hand brake upon air brake at Taschereau (Montreal). The test results are summarized in this LP report and the minimum required hand brakes on the occurrence train is calculated and the effects of variables are discussed.
2.0 Train brake system
2.1 Train air brakes
2.1.1
A train braking system is supplied with air by compressors located on each operating locomotive. The air is stored in each locomotive’s main reservoir at a pressure of approximately 125 psi to 140 psi. A feed valve maintains the brake pipe pressure at approximately 90 psi. A brake pipe runs along the entire train and is connected by hoses on both ends of the locomotives and the cars. Each car is equipped with its own braking system: brake cylinder, brake shoes, an auxiliary air reservoir, an emergency air reservoir, and other related components. The auxiliary reservoir supplies the air required for automatic braking whereas the emergency reservoir supplies the air required for emergency braking. Both car reservoirs are linked through an air brake valve and are recharged through the brake pipe.
2.1.2
When a brake application is required, the locomotive engineer (LE) manipulates the automatic brake handle on the locomotive control stand, removing air from the brake pipe. When the air brake valve senses a sufficient difference in pressure from the brake pipe, the brakes are activated (that is, the brake shoes are applied to the wheels).
2.1.3
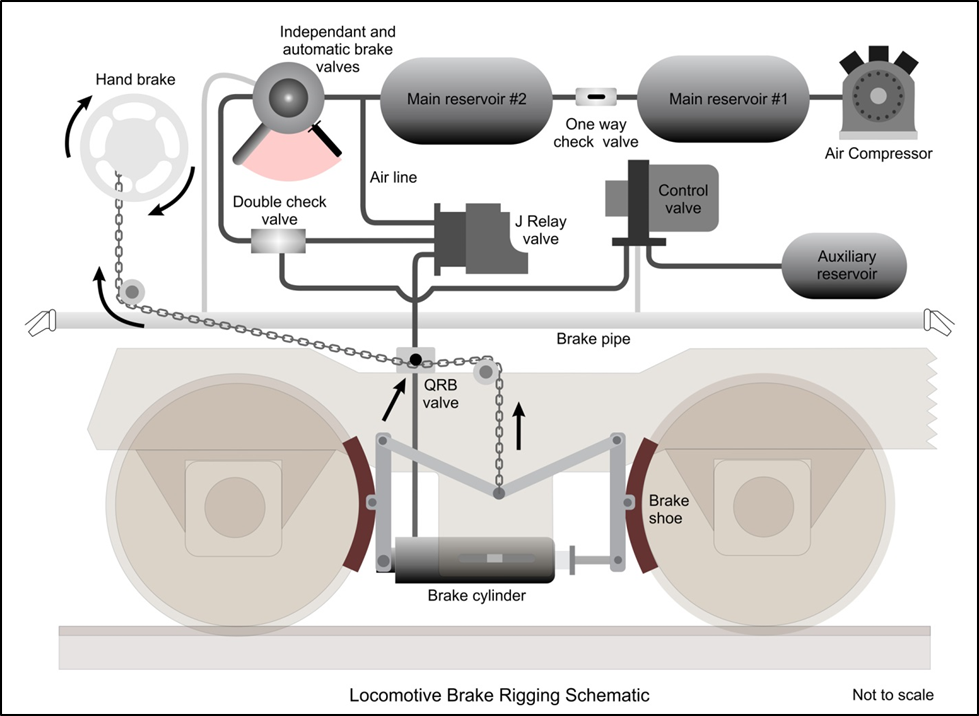
Each locomotive is also equipped with independent brakes in addition to the air brake system on cars as shown in Figure 4. These brakes, which are also supplied with air from the main reservoir, only apply on the locomotives. The independent brakes are controlled by the independent brake handle located on the control stand. The independent brakes are not normally used during train operations, but are primarily used as a parking brake. When the independent brakes are applied, they inject up to approximately 75 psi of air pressure into the brake cylinder, which then applies the brake shoes to the locomotive wheels.
2.1.4
When locomotives are shut down, the compressors are also shut down and will no longer supply air to the train. Many connections within the train and the locomotives are prone to air pressure leaks. Therefore, when locomotives are shut down, it is expected that the main reservoir pressure will eventually reduce. Once the main reservoir equalizes with the brake pipe, its pressure and the brake pipe pressure will begin to lower at the same rate. This also happens when the main reservoir and brake pipe reach the same pressure as in the brake cylinder. As the air in the brake cylinder decreases, the amount of force being applied to the locomotive wheels by the independent brakes reduces. Eventually, if the system is not recharged with air, the brakes will release.
2.1.5
Railway companies include instructions in their General Operating Instructions (GOIs) that, if the brake pipe pressure falls to 48 psi, the train must be stopped and the brake system must be recharged. Brake pipe pressure below 40 psi cannot be relied upon to initiate an emergency or penalty brake application.
2.2 Train hand brakes
2.2.1
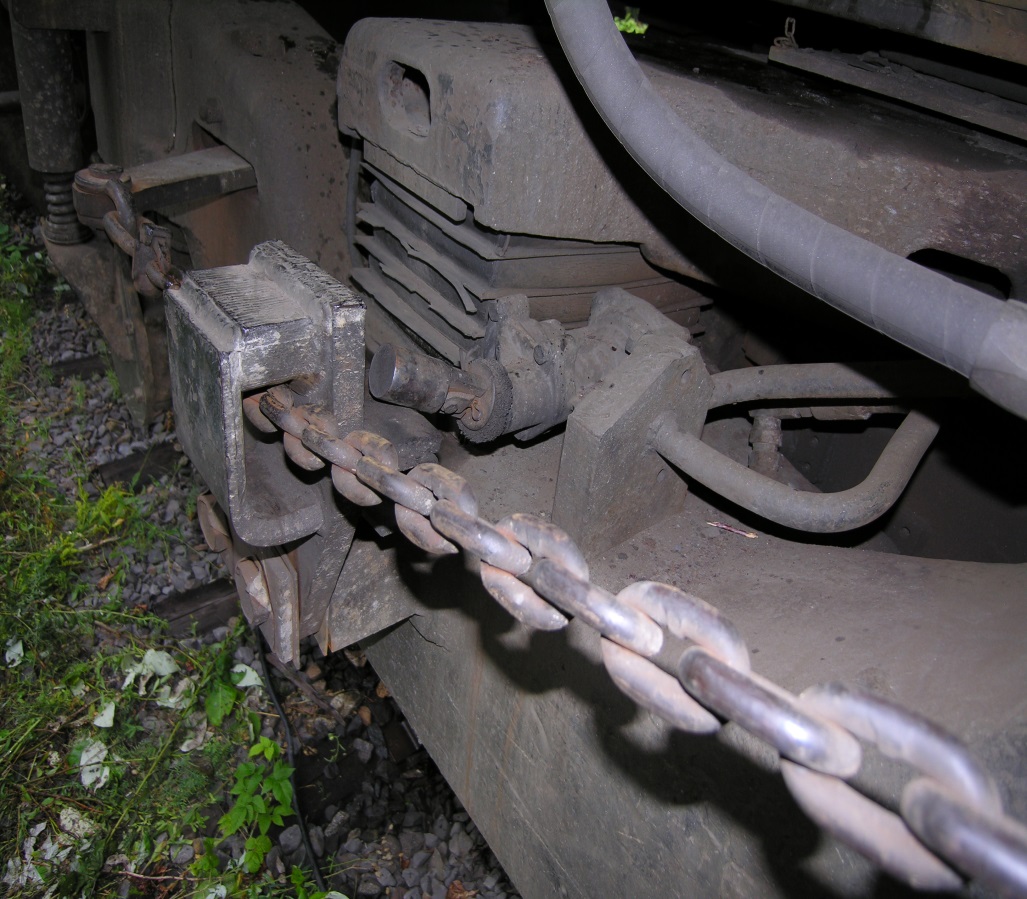
All locomotives and rail cars are equipped with a hand brake, a mechanical device allowing the brake shoes to be applied against the wheel treads to prevent the wheels from moving or to retard their motion (see Figure 5). Hand brake components include a chain linked to the brake rigging that, when tightened, applies the brakes on the equipment.
2.2.2
The effectiveness of hand brakes depends on several factors, including:
- the force exerted by the person applying the hand brake, which can vary widely from one operator to another
- hand brake gearing system lubrication; and
- lever adjustment.
2.3 Hand brake effectiveness test
2.3.1
To verify that the hand brakes applied on a train are sufficient to prevent an uncontrolled movement, crews are required to perform a hand brake effectiveness test. The test is performed as follows:
- Release all air brakes after the hand brakes have been applied.
- Allow the slack to adjust or attempt to move the cars slightly to ensure that they will not move.
2.3.2
If the cars cannot be moved, then the hand brakes are determined to be sufficient. If the cars can be moved, then additional hand brakes must be applied until a successful effectiveness test has been completed.
2.3.3
The special instructions for some railway companies in Canada, including MMA, permitted the hand brakes on the locomotive consist to be included in the minimum number of hand brakes to be applied. For example, if a company’s special instructions required at least 10 hand brakes to be applied and the train was operating with 4 locomotives, then only 6 hand brakes were required on the cars in addition to those applied on the locomotives.
2.4 Hand brakes on locomotives
2.4.1
For locomotives, the Federal Railroad Administration (FRA) requires that the hand brakes be capable of holding the unit on a 3% grade. This is equivalent to a brake ratio (the ratio of the brake shoe force over the gross load, BR) of 10% at a coefficient of friction of 0.3. There are no requirements for a locomotive to hold any other equipment when the hand brake is applied. On many locomotives, including the ones in this occurrence, when the hand brake is applied, only 2 of the 12 brake shoes are applied on the locomotive wheels. The FRA requires that the hand brake or parking brake (on locomotives so equipped), as well as its parts and connections, be inspected at least annually, or when repairs are required.
2.5 Hand brakes on cars
2.5.1
According to Section S401 of the Association of American Railroads (AAR) Manual of Standards and Recommended Practices (MSRP), in order to obtain an adequate braking force on cars, the force applied to the wheels by the brake shoes must be equal to about 10% of the car’s gross load when a torque of 125 foot-pounds is applied on the hand brake wheel. The end of the car where the hand brake is located designates the B end of the car. When hand brakes are tightened, all 8 brake shoes are normally applied to the wheels of the car.
2.6 Quick release brake valve
2.6.1
Three locomotives in the consist including the lead locomotive MMA 5017 were GE model C30-7 that had been placed into service in 1979. These locomotives are equipped with a 16-cylinder turbocharged four-stroke diesel engine which generated 3000 horsepower. This locomotive had 2 three-axle, three-motor trucks. It carried 4000 gallons of fuel, 365 gallons of coolant and 380 gallons of engine (lube) oil. It had a 26-L air brake system. The overall weight of MMA 5017 was approximately 195 tons.
2.6.2
On GE C30-7 locomotives, the brake cylinder on the axle where the hand brakes are applied is equipped with a quick release brake (QRB) valve. The QRB is tripped during the application of the hand brakes by the brake chain. When tripped, the QRB valve removes air from the brake cylinder and applies the brakes on the 2 wheels on which the hand brake is being applied. To ensure that the hand brake remains operational on these locomotives, MMA issued Summary Operating Bulletin 2-276 which stated in part:
-
Six Axle C-30-7: On six Axle C-30-7 locomotives equipped with QRB valves Series 5000, 3000 and 3600:
The hand brake will not tighten if the air from the R#2 brake cylinder is not exhausted. The handbrake chain will tighten and it may appear that the handbrake is set however if the R#2 brake cylinder is in the “out” position, the handbrake is not applied. On C-30-7 locomotives if an air exhaust is not heard while tightening the handbrake the QRB valve may be malfunctioning or out of adjustment.
It is possible to manually operate the valve from the ground on the right side of the locomotive. The QRB valve and handle is located directly adjacent to the handbrake chain, mounted on the top of the front truck between axles 2 and 3. A crew member can manually trip the valve by use of the lever located on the valve. After tripping the QRB valve the handbrake must immediately be re-tightened.
3.0 Brake tests on the occurrence locomotive consist
3.1 Test description
3.1.1
Air brake and hand brake tests were conducted on the occurrence locomotive consist. The locomotives from MMA-002 were moved to the siding at Vachon for examination and testing. Experts from Wabtec were invited to help in the testing. The examination and testing included:
- a brake leakage test of the entire consist,
- a full brake system evaluation of each locomotive, and
- brake shoe force testing.
3.1.2
The first test determined that, from a fully charged brake system, the brake cylinder pressure dropped to 27 psi in 1 hour and 6 minutes due to air leakage.
3.1.3
The second test evaluated the braking performance of each locomotive and its components and will be summarized in next section.
3.1.4
The brake shoe force test was to measure the brake shoe force under different air or hand brake applications. The retarding brake force is the product of the brake shoe force and the coefficient of friction between the wheel tread and brake shoes:
3.1.5
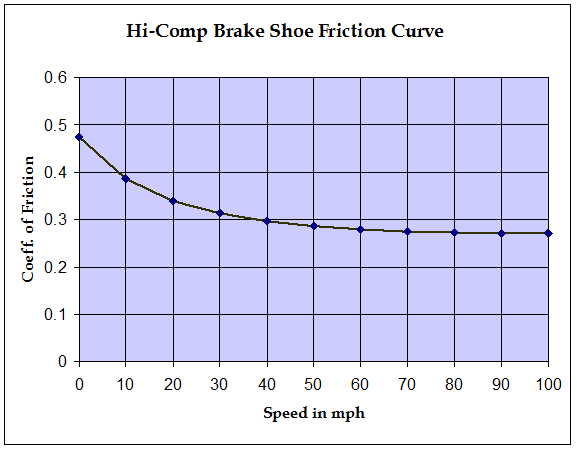
The coefficient of friction between wheel tread and composite brake shoes is related to the condition of the contact surface and the speed. An experimental curve of the friction and the speed is shown in Figure 6. Under normal condition, the average coefficient of friction is approximately 0.315 for speed range 0-100 mph. According to the Wabtec test experience, the average coefficient of friction of 0.38 is normally used in evaluation of stationary retarding brake force from the tested brake shoe force.
3.1.6
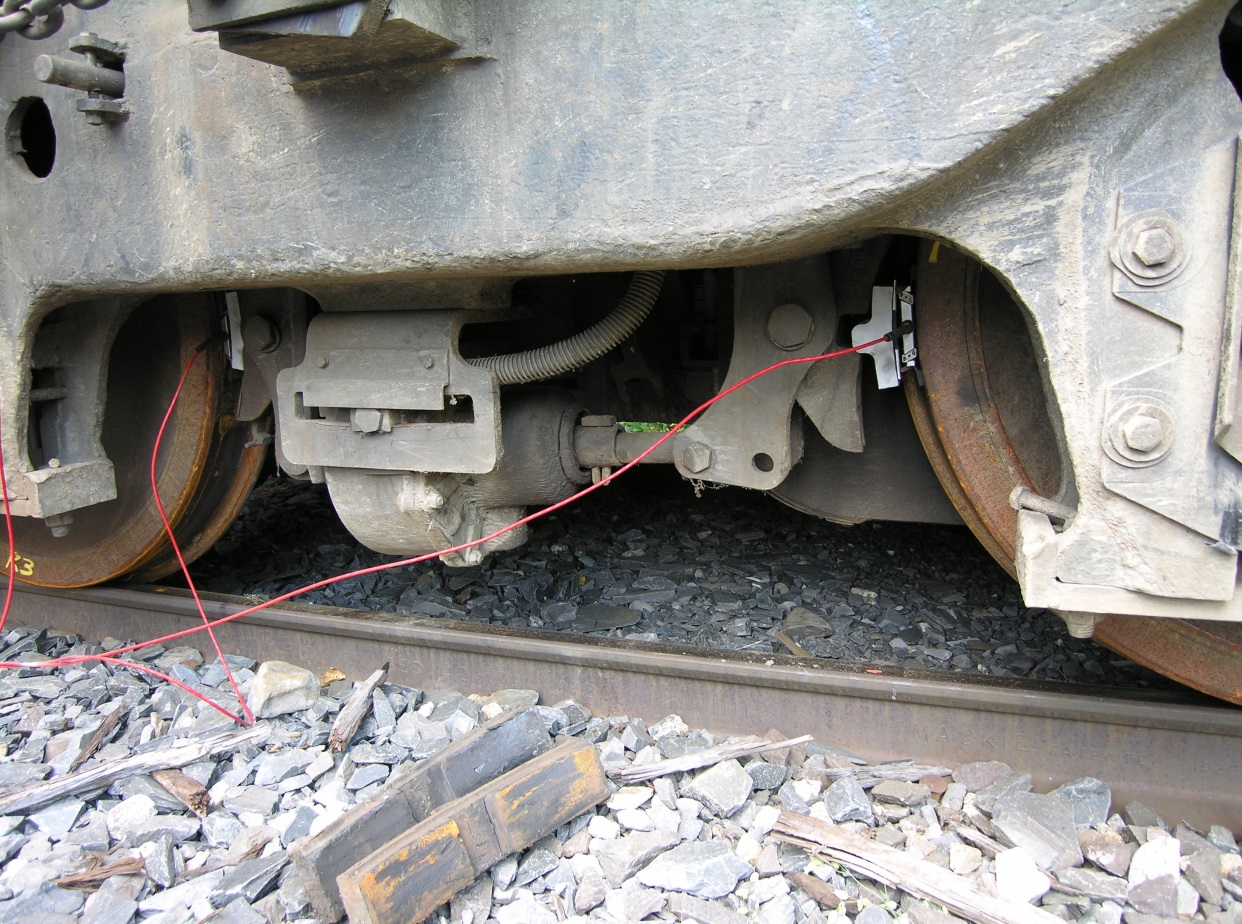
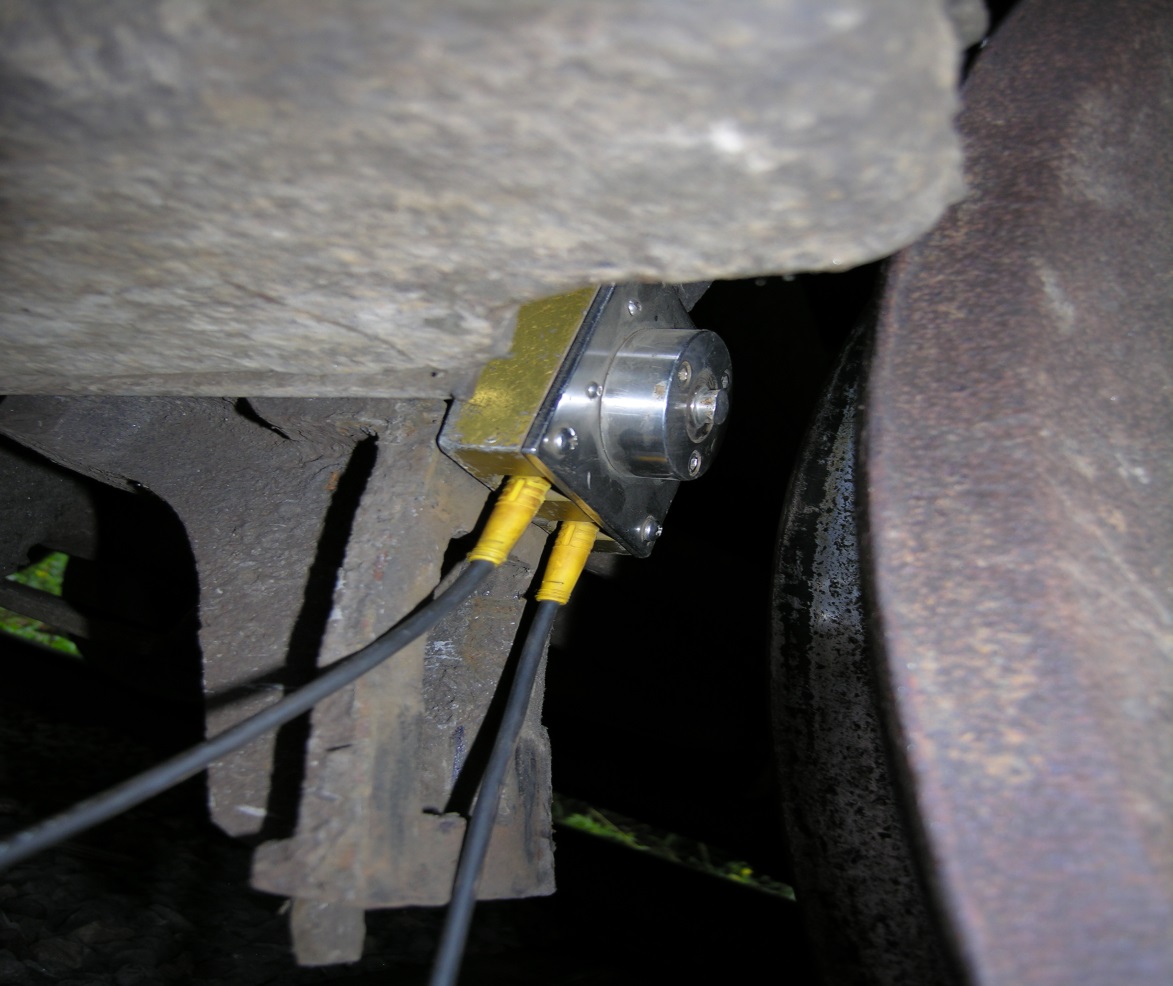
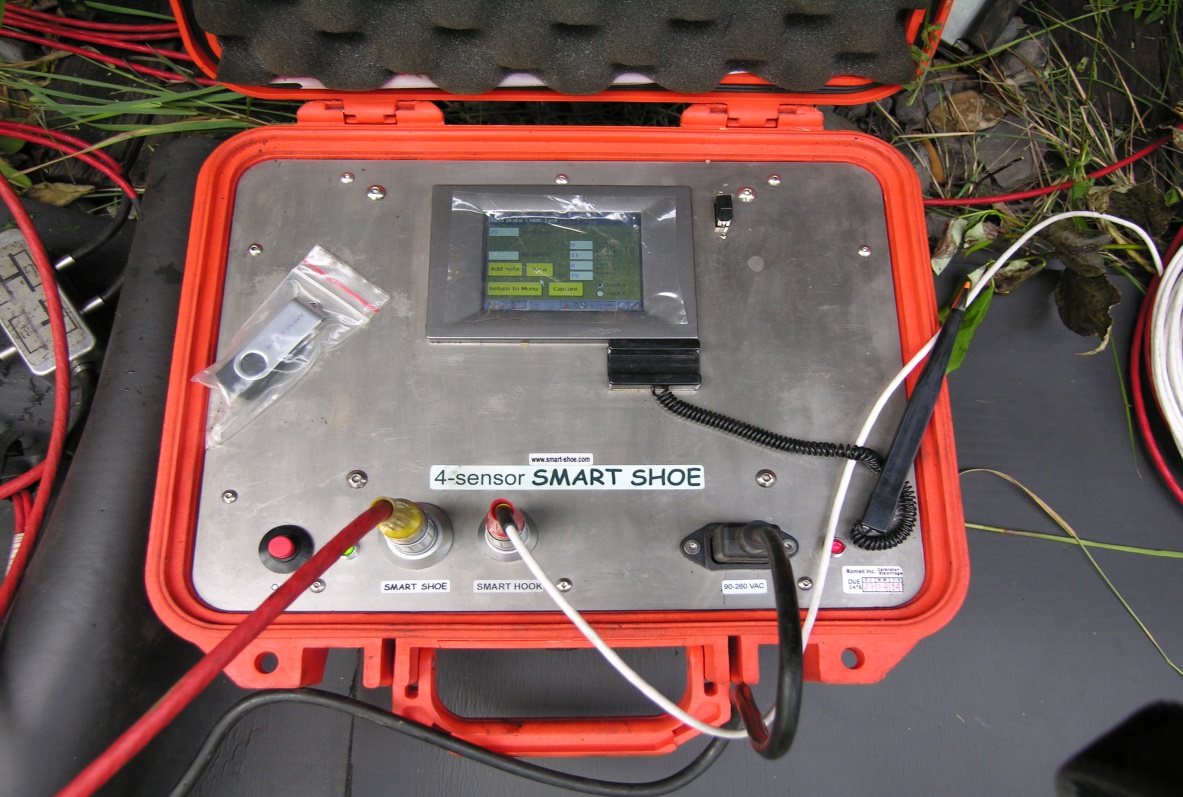
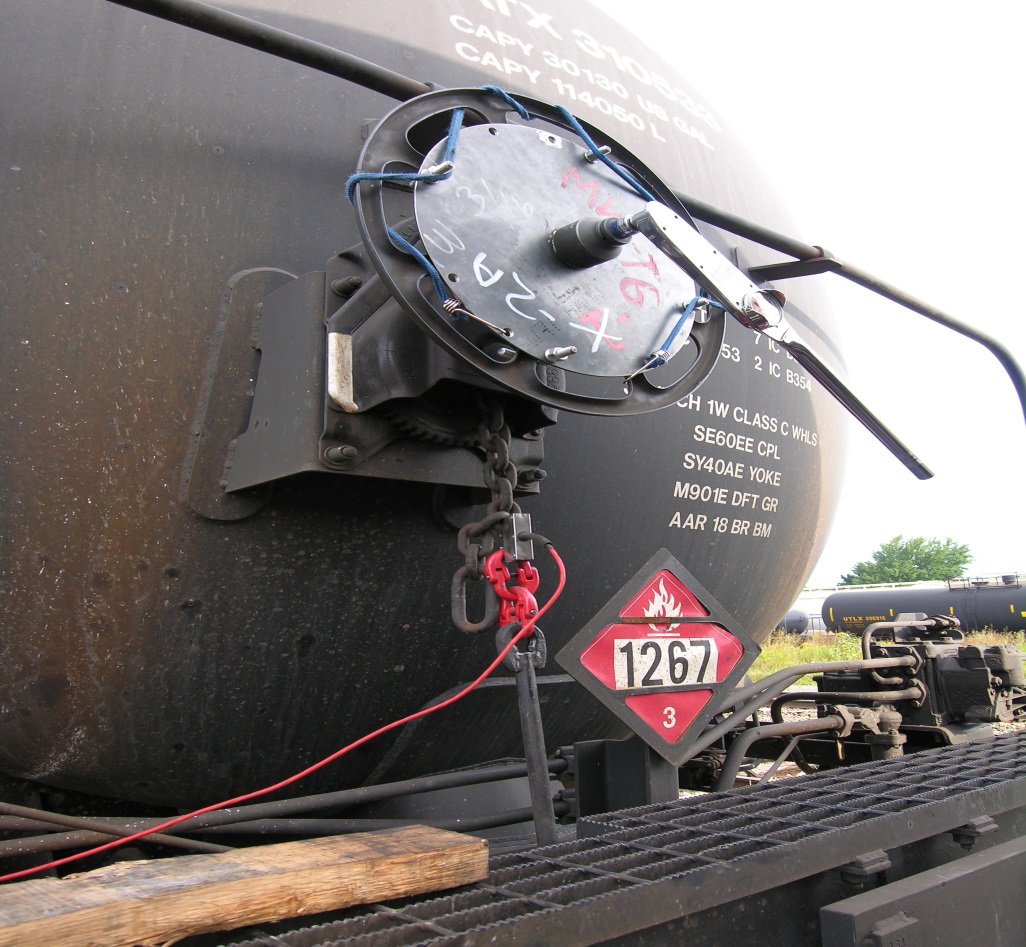
The brake shoe forces are measured by using specially designed and manufactured measurement kits. Golden shoe testing, Jim shoe testing and Smart shoe testing are the commonly used testing systems on market. In the tests that TSB conducted for this investigation, the Smart shoe testing system, as shown in Figure 7 was the main tool. A Jim shoe testing kit was used in testing of the VB car, but its measurement range was insufficient for testing of the locomotives and tank cars. The Golden shoe and Jim shoe systems use compressor sensors (Figure 8), while the Smart shoe uses adjustable bending stain gauge sensors to improve the accuracy. The Smart shoe system can save the readings into electronic text files.
3.1.7
A Smart shoe testing kit includes 4 or 8 sensors that replace the brake shoes and measure the pressure force (brake shoe force) on the wheel tread applied by the air cylinder pistol or hand brake chain. The sensors are connected to an integrated amplifier and monitor (Figure 9) to read the brake shoe forces from each of the wheels. The readings are summed to calculate the total brake shoe force and the brake ratio of the tested vehicle.
3.1.8
A sensor is inserted to measure the chain force that is a base index for the hand brake test. Simultaneously the torque on the handbrake wheel is also measure by a ranger with torque scale, as shown in Figure 10.
3.2.1 Brake system examination
3.2.1
The full brake system examination and testing evaluated the braking performance of each locomotive and its components. The testing results are summarized below:
3.2.2
MMA 5017
- Excessive leakage was occurring from the main reservoir, the main reservoir check valve, and the brake piping on both locomotive trucks.
- The air leakage in the rear truck was too large to be tested.
- Excessive blowing was occurring from the compressor relief valve, resulting in a loss of air from the No. 1 main reservoir.
- The bell valve was leaking, resulting in a loss of air from the No. 1 main reservoir.
- The N1 reducing valve was excessively blowing, resulting in a loss of air from the No. 2 main reservoir.
3.2.3
MMA 5026
- Minor air leakage was occurring from the main reservoir, the brake pipe and the 20 line.
- The front truck leaked off completely in 4 minutes.
3.2.4
CITX 3053
- Minor air leakage was occurring from the main reservoir.
- The cut-out valve on the front truck was exhausting air through the vent excessively when placed in the closed position.
- The ball in the cut-out valve was out 180° from its operating position, resulting in loss of air from the locomotive side and not the truck side.
3.2.5
MMA 5023
- Minor air leakage was occurring from the main reservoir, the main reservoir check valve, the brake pipe and the 20 line.
- The front truck leaked off 30 psi in 5 minutes.
3.2.6
CEFX 3166
- Minor air leakage was occurring from the main reservoir and the 20 line.
- Excessive air leakage was occurring from the main reservoir check valve and both trucks.
- The dead engine regulator was leaking excessively through the vent, resulting in a pressure loss for the No. 2 main reservoir.
3.2.7
Due to the excessive leaking on several brake valves from the locomotive consist found in the test, 4 air brake valves and the QRB valve were removed for further examination by the TSB (Engineering Laboratory Report LP185/2013).
3.3 Brake shoe force test results
3.3.1
Two Smart shoe kits and a Jim shoe kit were used in the test. The Jim shoe kit was only used on VB-1 car due to its limited shoe force measurement range.
3.3.2
A Wabtec staff controlled the display unit of the test kits and read the measurement. A TSB staff recorded the readings and processed the data to calculate the brake ratios.
3.3.3
The tested locomotive consist included MMA5017, VB-1, MMA5026, CITX3053, MMA5023, CEFX3166 in the same order as in the occurrence. VB-1 is a remote control car with a cylinder pressure regulator to change the IND pressure from the locomotives.
3.3.4
A summary of the test brake shoe force is listed in Table 1a and Table 1b. The calculated brake ratios are listed in Table 2a and Table 2b.
| Air Brake | BC psi | MMA 5017 | MMA VB-1 | MMA 5026 | CITX 3053 | MMA 5023 | CEFX 3166 | Total | Total |
|---|---|---|---|---|---|---|---|---|---|
| Full IND | 72 | 146079 | 5792 | 145977 | 101931 | 141599 | 115891 | 657269 | 249762 |
| Full Service | 55 | 111250 | 4151 | 120573 | 86159 | 113234 | 99715 | 535082 | 203331 |
| BR Base | 50 | 100005 | 3745 | 99873 | 79195 | 104758 | 89988 | 477564 | 181474 |
| Start to Move | 27 | 57350 | 2993 | 62765 | 50725 | 62754 | 61659 | 298246 | 113333 |
| Hand Brake | T ft-lb | MMA 5017 | MMA VB-1 | MMA 5026 | CITX 3053 | MMA 5023 | CEFX 3166 | Total | Total |
|---|---|---|---|---|---|---|---|---|---|
| low power | 60 | 7232 | 6596 | 7944 | 10002 | 8297 | 9210 | 49281 | 18727 |
| normal power | 80 | 9209 | 9419 | 10085 | 13795 | 10556 | 13686 | 66750 | 25365 |
| high power | 100 | 11731 | 11509 | 12716 | 18202 | 13526 | 17443 | 85127 | 32348 |
| extreme power | 150 | 18485 | 15714 | 16253 | 26071 | 18765 | 24479 | 119767 | 45511 |
| AAR test capability | 200 | 23174 | 21653 | 20414 | 33551 | 24531 | 31881 | 155204 | 58978 |
| Air Brake | BC psi | MMA 5017 | MMA VB-1 | MMA 5026 | CITX 3053 | MMA 5023 | CEFX 3166 |
|---|---|---|---|---|---|---|---|
| Full IND | 72 | 37.5% | 9.7% | 37.4% | 26.4% | 36.3% | 29.6% |
| Full Service | 55 | 28.5% | 6.9% | 30.9% | 22.3% | 29.0% | 25.4% |
| BR Base | 50 | 25.6% | 6.2% | 25.6% | 20.5% | 26.9% | 23.0% |
| Start to Move | 27 | 14.7% | 5.0% | 16.1% | 13.1% | 16.1% | 15.7% |
| Hand Brake | T ft-lb | MMA 5017 | MMA VB-1 | MMA 5026 | CITX 3053 | MMA 5023 | CEFX 3166 |
|---|---|---|---|---|---|---|---|
| low power | 60 | 1.9% | 11.0% | 2.0% | 2.6% | 2.1% | 2.3% |
| normal power | 80 | 2.4% | 15.7% | 2.6% | 3.6% | 2.7% | 3.5% |
| high power | 100 | 3.0% | 19.2% | 3.3% | 4.7% | 3.5% | 4.4% |
| extreme power | 150 | 4.7% | 26.2% | 4.2% | 6.8% | 4.8% | 6.2% |
| AAR test capability | 200 | 5.9% | 36.1% | 5.2% | 8.7% | 6.3% | 8.1% |
3.3.5
The air brake readings in general were more stable and converging, while the hand brake readings showed more deviation. It is difficult to apply and maintain a stable torque compared to a BC, therefore torque measurement is less accurate than that of chain force.
3.3.6
All hand brake ratios of the locomotives at the highest test torque of 200 ft-lbs were lower than the required 10%, with those of CITX3053 and CEFX3166 closer to 10%
3.3.7
The hand brake ratio of VB-1 was much higher than those of the locomotives, but its air brake ratio was lower than those of the locomotives.
3.3.8
Three locomotives in the consist were equipped with the QRB as shown in Figure 11. The QRB on the second locomotive (MMA 5026) was determined to be defective, while the other two worked properly. When the hand brake was applied, the QRB at MMA 5026 did not release the cylinder air. In this situation, there would not have been any hand brake force if the QRB was not manually tripped.
3.3.9
A recorded test loop on MMA 5026 showing the QRB malfunction is listed in Table 3.
| BC + Torque | R2 | R3 | Sum | BR | Comments | |
|---|---|---|---|---|---|---|
| INDBC72+T0 | 0 | 11649 | 10450 | 22099 | 5.7% | IND only, Fbs on two wheels |
| IND+T195 | 3580 | 12264 | 12047 | 24311 | 6.2% | BC not released by QRB |
| BC50+T195 | 2591 | 9285 | 8448 | 17733 | 4.5% | Reduce BC by LE |
| BC27+T195 | 1430 | 5278 | 4701 | 9979 | 2.6% | |
| BC0+T195 | 37 | 33 | 69 | 102 | 0.0% | HB totally lost |
| Reapp IND | 2591 | 13415 | 11745 | 25160 | 6.5% | |
Note: is the chain force, BR is brake ratio Conclusion: QRB was not functional, HB would loss when BC bled off |
||||||
3.3.10
The air brake test loop was designed as IND-BC72->Full service BC55->Start to Move BC27 and then re-increased back to BC50. This test loop simulated the air drop in the occurrence and checked the base reading on the increase route. It worked well except on the front trucks of CITX3053 and CEFX3166.
3.3.11
The measured shoe force on the two front trucks froze during the IND BC drop from BC72 to BC 55. The measured shoe forces at BC55 in a test loop of CITX 3053 were significantly different on the route of drop and build up as in Table 4.
| L1 | L2 | L3 | R1 | R2 | R3 | Total | BR | |
|---|---|---|---|---|---|---|---|---|
| INDBC72 | 9223 | 8963 | 7780 | 8931 | 9339 | 7844 | 52080 | 27.0% |
| BC55 | 8915 | 8770 | 7900 | 8260 | 9166 | 7909 | 50920 | 26.4% |
| BC27 | 4337 | 4592 | 4283 | 4414 | 4939 | 4290 | 26855 | 13.9% |
| BC50 | 7091 | 6858 | 6201 | 7076 | 7286 | 6161 | 40673 | 21.1% |
| BC55 | 7600 | 7417 | 6667 | 7498 | 7834 | 6625 | 43641 | 22.6% |
| BC72 | 9165 | 9034 | 7950 | 8922 | 9258 | 7790 | 52119 | 27.0% |
3.3.12
A test loop on CEFX 3166 in Table 5 showed the freezing continued below BC40 but the shoe force readings at BC27 remained very close on the routes up and down. An alternative test loop (Front Truck IND72->BC27->BC50->BC55) was used to prevent this freezing in the test of the two front trucks. All the other tests kept the designed test loop.
| L1 | L2 | L3 | R1 | R2 | R3 | Total | BR | ref test BR | |
|---|---|---|---|---|---|---|---|---|---|
| IND BC72 | 11383 | 9280 | 9966 | 9223 | 10443 | 8026 | 58321 | 29.8% | 29.6% |
| BC55 | 11031 | 8667 | 9295 | 9102 | 10152 | 8022 | 56269 | 28.7% | 25.4% |
| BC50 | 10164 | 8048 | 8607 | 8561 | 9502 | 7587 | 52469 | 26.8% | 23.0% |
| BC45 | 9296 | 7500 | 7968 | 8039 | 8800 | 7185 | 48788 | 24.9% | |
| BC40 | 8289 | 6759 | 7144 | 7290 | 7808 | 6557 | 43847 | 22.4% | |
| BC35 | 7397 | 6128 | 6399 | 6622 | 6886 | 5944 | 39376 | 20.1% | |
| BC27 | 5764 | 4959 | 5037 | 5380 | 5300 | 4786 | 31226 | 15.9% | 15.7% |
3.3.13
The reason for this freezing of the brake shoe force during the IND BC drop was not known. However it does not affect the analysis of the runaway which started at BC27.
3.3.14
An examination of the measured brake shoe force generated by the locomotive consist and VB car with both air and hand brakes concluded that:
- Assuming a coefficient of friction of 0.38, the total retarding force generated by the locomotive consist and VB car full IND air brakes was 249 762 pounds.
- Assuming 100 foot-pounds of torque and a coefficient of friction of 0.38, the total retarding force generated by the locomotive consist and VB car hand brakes was 32348 pounds.
- When the independent brakes were fully applied, there was enough retarding force to keep the train immobilized.
- The braking force for the independent brakes at 27 psi was reduced to approximately 45% of a fully applied independent brake.
- The average brake ratio for the locomotive hand brakes at 100 foot-pounds of torque was approximately 3.8%.
- The brake ratio for the VB car at 100 foot-pounds of torque was 19.2%.
4.0 Brake test of surviving tank cars
4.1 Test description
4.1.1
The 9 non-derailed tank cars from MMA-002 were taken to Farnham for air brake and hand brake testing. The hand brake wheel of the buffer box car was also taken to Farnham and installed on a tank car to obtain the hand brake feature of the box car. As the air brake on the tank cars were released before the runaway occurred, air brake tests were only conducted on two tank cars to examine their air brake ratios. The focus of the testing was on the hand brakes of the surviving tanks cars and the simulated box car.
4.1.2
Simiar to the testing on the locomotive consist, Smart shoe kits but no Jim shoe kit were used in the air and hand brake testing to measure the brake shoe forces. The air brake test was conducted by using a single car air brake test kit as shown in Figure 12. The air brake tests were conducted at minimum application (6-7 psi BP reduction) and full service application. Two test loops were applied on each car and the brake shoe forces were measured at Service Equalization and Wrapped condition respectively. The brake ratios were calculated and averaged.
4.1.3
The hand brake testing was conducted at a number of torques covering the normal manpower range and the AAR hand brake test capability limit. The brake rigger badge plate was reviewed and theoretical brake shoe force was calculated. The measured brake shoe force were recorded and checked against the AAR requirement.
4.2 Air brake system examination and test
4.2.1
The Wabtec experts helped conduct the examination of the air brake system and the single car test. This examination determined that
- The brake equipment on the tank cars were functional and met AAR requirements.
- A single car air brake test was conducted on 2 of the tank cars. Both tank cars passed the test.
4.2.2
The measured air brake shoe forces and brake ratios are listed in Table 6.
| Car No. | Min App (6-7) | FULL SERVICE | |||||
|---|---|---|---|---|---|---|---|
| Ser EQ | Wrapped | ||||||
| BC | BC | BR | BR | ||||
| NATX310406 | 8.4 | 2602 | 63.6 | 25380 | 9.7% | 27315 | 10.4% |
| 63.6 | 25294 | 9.6% | 27285 | 10.4% | |||
| Sub-average | 25337 | 9.6% | 27300 | 10.4% | |||
| WFIX130629 | 8.4 | 1441 | 63.5 | 20754 | 7.9% | 23973 | 9.1% |
| 63.6 | 21483 | 8.2% | 23981 | 9.1% | |||
| Sub-average | 21119 | 8.0% | 23977 | 9.1% | |||
| Average | 63.6 | 23228 | 8.8% | 25639 | 9.7% | ||
4.3 Hand brake test results
4.3.1
The measured brake shoe forces are summarized and listed in Table 7a and Table 7b together with the chain forces or applied torques.
4.3.2
The VFc 3350 cases except ACFX73452H were the results at vertical chain force of 3350 lbs which is the defined test chain force for the AAR required BR for Type N hand brakes. The corresponding measured BRs were above the AAR required 10% except Car PROX44211 whose BR was 8.2%. The 8.2% value was higher than the required hand brake ratio of 6.5% for the worn cars in service.
4.3.3
The applied torques corresponding to the designated test vertical chain force of 3350 lbs varied widely from 100 to 150 ft-lbs, however, the average torques for the 6, 9 and 10 cars were 127, 123 and 123 ft-lbs which were close to the AAR test reference torque of 125 ft-lbs in MSRP S-401. This confirmed the validity of the relationship between the test reference vertical chain force 3350 lbs and torque 125 ft-lbs but also demonstrated the wide variation of the torque range. TSB experience, based on a number of previous hand brake tests indicated it is difficult for a normal worker on site to reach the 125 ft-lbs reference torque. A normal worker likely applies a hand brake in a torque range of 80 to 100 ft-lbs.
| Car No. | VFc 3350 | T60 | T80 | ||||||
|---|---|---|---|---|---|---|---|---|---|
| T | BR | BR | BR | ||||||
| NATX310406 | 125 | 31683 | 12.0% | 1525 | 13630 | 5.2% | 2080 | 18727 | 7.1% |
| NATX310425 | 125 | 29127 | 11.1% | 1105 | 11226 | 4.3% | 2165 | 20885 | 7.9% |
| NATX310487 | 110 | 29585 | 11.2% | 1390 | 12458 | 4.7% | 2035 | 18267 | 6.9% |
| NATX310533 | 110 | 29979 | 11.4% | 1695 | 14607 | 5.6% | 2480 | 21094 | 8.0% |
| NATX310572 | 150 | 28524 | 10.8% | 1535 | 13374 | 5.1% | 2055 | 17607 | 6.7% |
| NATX310595 | 140 | 26656 | 10.1% | 1465 | 9587 | 3.6% | 1950 | 13748 | 5.2% |
| ACFX73452 | 125 | 28487 | 10.8% | 1615 | 14421 | 5.5% | 1985 | 18107 | 6.9% |
| PROX44211 | 125 | 21462 | 8.2% | 1845 | 12749 | 4.8% | 2055 | 15008 | 5.7% |
| WFIX130629 | 100 | 26699 | 10.2% | 2125 | 14875 | 5.7% | 2840 | 20418 | 7.8% |
| BOX CAR | 123 | 29468 | 11.2% | 1467 | 12907 | 4.9% | 2188 | 19444 | 7.4% |
| ACFX73452H | 125 | 29665 | 11.3% | 1710 | 11015 | 4.2% | 2415 | 15582 | 5.9% |
| 6NATXAverg | 127 | 29259 | 11.1% | 1453 | 12480 | 4.7% | 2128 | 18388 | 7.0% |
| 9TanksAverg | 123 | 28022 | 10.7% | 1589 | 12992 | 4.9% | 2183 | 18207 | 6.9% |
| 10CarsAverg | 123 | 28167 | 10.7% | 1577 | 12983 | 4.9% | 2183 | 18331 | 7.0% |
| Car No. | T100 | T150 | T200 | ||||||
|---|---|---|---|---|---|---|---|---|---|
| T | BR | BR | BR | ||||||
| NATX310406 | 2530 | 22459 | 8.5% | 3940 | 35578 | 13.5% | 4530 | 41398 | 15.7% |
| NATX310425 | 2805 | 24978 | 9.5% | 4060 | 35689 | 13.6% | 5905 | 54866 | 20.9% |
| NATX310487 | 2695 | 24070 | 9.2% | 4680 | 41657 | 15.8% | 5250 | 47711 | 18.1% |
| NATX310533 | 3185 | 27084 | 10.3% | 4445 | 39230 | 14.9% | 7450 | 67991 | 25.9% |
| NATX310572 | 2870 | 24786 | 9.4% | 3570 | 30631 | 11.6% | 5000 | 44265 | 16.8% |
| NATX310595 | 2175 | 15969 | 6.1% | 3215 | 25978 | 9.9% | 5015 | 43436 | 16.5% |
| ACFX73452 | 2455 | 22118 | 8.4% | 3640 | 31254 | 11.9% | 5495 | 47347 | 18.0% |
| PROX44211 | 2620 | 19445 | 7.4% | 3375 | 23343 | 8.9% | 4765 | 32846 | 12.5% |
| WFIX130629 | 3290 | 23836 | 9.1% | 4510 | 33627 | 12.8% | 6255 | 47348 | 18.0% |
| BOX CAR | 2945 | 26126 | 9.9% | 4757 | 41880 | 15.9% | 5615 | 48988 | 18.6% |
| ACFX73452H | 2950 | 19250 | 7.3% | 4640 | 29479 | 11.2% | 6475 | 38831 | 14.8% |
| 6NATXAverg | 2710 | 23224 | 8.8% | 3985 | 34794 | 13.2% | 5140 | 46335 | 17.6% |
| 9TanksAverg | 2736 | 22749 | 8.6% | 3937 | 32999 | 12.5% | 5277 | 44902 | 17.1% |
| 10CarsAverg | 2757 | 23087 | 8.8% | 4019 | 33887 | 12.9% | 5314 | 45356 | 17.2% |
Note:
- is chain force, is brake shoe force, BR is brake ratio
- All the VFc 3350 cases except ACFX73452H are the results at vertical chain force of 3350 lbs which is the defined test chain force for the AAR required BR for Type N hand brakes.
- ACFX73452H is the case using horizontal chain force of 4700 lbs, which is equivalent to vertical chain force of 3350 lbs.
4.3.4
At 80 foot-pounds of torque, the measured average brake shoe force of the 9 test tank cars was about 18207 lbs. Assuming a coefficient of friction of 0.38, the average retarding force generated by the hand brakes was approximately 6919 pounds per car.
4.3.5
At 100 foot-pounds of torque, the measured average brake shoe force of the 9 test tank cars was about 22749 lbs. Assuming a coefficient of friction of 0.38, the average retarding force generated by the hand brakes of the 9 test tank cars was approximately 8645 pounds per car.
4.4 Measured hand brake torques from the vehicles in Farnham Yard
4.4.1
The TSB investigation team also measured the actual residual hand brake torques on the fleets of cars and locomotives parked in the Farnham yard. As the MMA operates several trains by 1 person crew, it is normal for the crew to apply air brake to stop the cars and then apply hand brake upon the air brake. The actual torques were measured twice. First with the brake cylinder air applied. Then the brake cylinder air was released and the residual torques were measured again.
4.4.2
The average measured torques were between 86 and 98 ft-lbs and exhibited wide variation, which matched the experience obtained by the TSB in previous investigations. The average difference between the existing torques and the corresponding torques after the brake air was released was about 25 to 75 ft-lbs. Therefore, torque range of 80-100 ft-lbs was used in the analysis of this report to estimate the minimum required hand brakes.
5.0 Test of hand brake upon air brake on tank cars
5.1 Test description
5.1.1
The experience and the measured torque data from the Farnham yard indicated that if the hand brake was applied upon an air brake application, the resulting brake shoe force may be significantly different from the hand brake only applications. As the MMA operates several trains by 1 person crew, it is normal for the crew to apply air brake to stop the cars and then apply hand brake upon the air brake. On the occurrence day, the LER recorded that the locomotive engineer applied 13 psi reduction automatic air brake to stop the train and then applied the hand brakes upon the air brake. This hand brake upon air brake application might result in different brake shoe forces than the measured results in the hand brake test in Farnham. An extra test was conducted to investigate the difference and modify the average brake shoe force from hand brake used in the analysis and estimate of the required minimum hand brakes.
5.1.2
The extra test was conducted on a few tank cars in the CN Taschereau (Montreal) yard. These tank cars were not involved in the accident. The test was designed to obtain the ratio of the hand brake shoe force in the hand brake upon air brake of 13 psi reduction over the hand brake only scenario. This ratio could be used to modify the test results of the surviving cars and locomotives in the previous tests.
5.1.3
The test method and equipment were the same as in the previous two tests. The Smart shoe kit was used to measure the brake shoe forces. Each test included an incremental hand brake only application and release loop first. Then air brake was applied followed by hand brakes application upon the air brake then the air was released. The brake shoe force was measured at each step of the test. The brake shoe force after the air brake released was compared with the corresponding hand brake only result and the increase ratio was calculated.
5.1.4
A complete test was conducted on tank car NATX 270035. The tests were only conducted on the B-end truck of car TILX160220 and OLNX224074 and due to the time limits and weather conditions, the number of test increments were reduced. The application and stabilization of the air reduction were very difficult to control and the process was time consuming. However, the test data from the complete test on NATX 270035 provided a good basis upon which to extend B-end truck test results to cover the entire car.
5.2 Test results of hand brake upon air brake
5.2.1
As only one Smart shoe test kit was available, the testing had to be conducted one truck after another. This induced the variation of the applied torques. The variation of applied torque was inevitable and difficult to control because the torque ranger had to be held on the next gear. When high air brake application was applied first, the hand brake at high torque was very tight, the next gear could induced a big difference. The measured brake shoe forces from the A-end and B-end truck of car NATX 270035 under the same hand brake torques or BC applications were compared first. It was found that the measured brake shoe force at A-end truck was about 4% to 6% higher than those at B-end which was in contrast to the normal expectation that B-end was closer to the hand brake and produced higher brake shoe force. On the other hand, this reverse difference indicated the effect of the different ends on the measured brake shoe force was smaller than the variations caused by the diverging applied hand brake torques. Therefore, the brake shoe forces on the B-end truck of car TILX160220 and OLNX224074 were simply doubled to obtain the brake shoe force of the entire car.
5.2.2
The difference between the hand brake upon air brake and the hand brake only was closely related to the air brake level. At the minimum application, the air brake produced minor shoe force and induced very little difference. As the air reduction increased, the difference became significant. The increase ratio at the 13 psi air brake application as in the occurrence could reach approximately 1.4 on average as listed in Table 8. This average increase ratio is used to adjust the brake shoe forces of the surviving vehicles in later analysis.
5.2.3
The brake shoe force at the air + hand brake was generally the sum of the air brake and hand brake. Once the air brake was released, the hand brake chain kept holding the lever and the brake shoe force reduced only slightly. The increase ratio was basically the ratio of the air brake shoe force over the hand brake shoe force.
| Scenario | NATX270035 | TILX160220 | OLNX224074 | Ratio | |||
|---|---|---|---|---|---|---|---|
| Ratio | Ratio | Ratio | average | ||||
| HBT80 | 21591 | 1 | 23213 | 1 | 20506 | 1 | |
| Air DBP13 | 7578 | 0.351 | 10942 | 0.471 | 6739 | 0.329 | |
| Air+HB | 29378 | 1.361 | 34259 | 1.476 | 31768 | 1.549 | |
| HB/Air off | 27776 | 1.286 | 33862 | 1.459 | 30543 | 1.489 | 1.411 |
| HBT100 | 27199 | 1 | 28925 | 1 | 27334 | 1 | |
| AirDBP13 | 7661 | 0.282 | 11376 | 0.393 | 6644 | 0.243 | |
| Air+HB | 34724 | 1.277 | 44264 | 1.53 | 39297 | 1.438 | |
| HB/Air off | 33401 | 1.228 | 43694 | 1.511 | 38103 | 1.394 | 1.378 |
Note:
- DBP13 represents BP reduction of 13 psi
- HBT80 and HBT100 represents hand brake at torque 80 and 100 ft-lbs respectively
5.2.4
As the air brake increased, the increase ratio also increased. The measured brake shoe forces and increase ratios at 20 psi reduction and full service (26 psi reduction) are listed in Table 9a and Table 9b. The average increase ratios could reach 1. 6 to 1.9 for the 20 psi reduction scenario. The full service test was only conducted on NATX 270035, which produced lower brake shoe force than the other cars. However, comparatively its increase ratio at full service was significantly higher than that at the 20 psi reduction.
| Scenario | NATX270035 | TILX160220 | OLNX224074 | Ave. | |||
|---|---|---|---|---|---|---|---|
| Ratio | Ratio | Ratio | Ratio | ||||
| HBT80 | 21591 | 1 | 23213 | 1 | 20506 | 1 | |
| Air DBP20 | 14704 | 0.681 | 19028 | 0.82 | 14956 | 0.729 | |
| Air+HB | 35191 | 1.63 | 53008 | 2.284 | 40478 | 1.974 | |
| HB/Air off | 32047 | 1.484 | 51992 | 2.24 | 38318 | 1.869 | 1.864 |
| HBT100 | 27199 | 1 | 28925 | 1 | 27334 | 1 | |
| AirDBP20 | 14417 | 0.53 | 18066 | 0.625 | 15142 | 0.554 | |
| Air+HB | 40232 | 1.479 | 54702 | 1.891 | 47296 | 1.73 | |
| HB/Air off | 37282 | 1.371 | 53710 | 1.857 | 45128 | 1.651 | 1.626 |
Note:
- DBP20 represents BP reduction of 20 psi
- HBT80 and HBT100 represents hand brake at torque 80 and 100 ft-lbs respectively
| Scenario | NATX270035 | |
|---|---|---|
| Ratio | ||
| HBT80 | 21591 | 1 |
| Air DBP20 | 18230 | 0.844 |
| Air+HB | 40302 | 1.867 |
| HB/Air off | 36446 | 1.688 |
| HBT100 | 27199 | 1 |
| AirDBP20 | 18175 | 0.668 |
| Air+HB | 44756 | 1.646 |
| HB/Air off | 41825 | 1.538 |
Note: Full Service, BP reduction of 26 psi
5.3 Previous test results from the Hanlon investigation
5.3.1
The TSB conducted similar hand brake tests in previous investigations. A hand brake test and a stationary rolling resistance test were conducted on gondola cars for the Hanlon accident in 2012 (R12E0004) [3]. The brake shoe forces were measured under hand brake only, emergency brake, hand brake upon emergency and handbrake after emergency brake released. The measured results are reused and listed here in Table 10 for reference. The applied torques in hand brake only were about 85- 90 ft-lbs at first. The torques increased about 20 ft-lbs after the emergency was released. The increase ratio of the brake shoe force in the hand brake upon emergency could reach 3.8.
| Test | CN199183 | CN199199 | ||||
|---|---|---|---|---|---|---|
| lb | Ratio | Torque ft-lb | lb | Ratio | Torque ft-lb | |
| Hand Brake only | 12116 | 1 | 85/90 | 12523 | 1 | 85/90 |
| Emergency upon hand brake | 33611 | 2.774 | 31135 | 2.486 | ||
| Residual HB after Release emergency air | 9991 | 0.825 | 15231 | 1.216 | ||
| Emergency air only | 33506 | 2.765 | 30885 | 2.466 | ||
| Hand brake upon emergency | 51637 | 4.262 | 51885 | 4.143 | ||
| Residual HB after Release emergency air | 46859 | 3.868 | 100/125 | 47588 | 3.8 | 105/110 |
Note: The torques were measured when the test was on A-end and B-end trucks respectively
6.0 Analysis
6.1 Retarding forces on the train starting to run away
6.1.1
On the day of occurrence, the train stopped on an average descending gradient of 0.918%. The train weighed 10287 tons which induced a grade force of 188869 lbs. Assuming the stationary rolling resistance rate was about 4.1 lbs/ton, the rolling resistance on the train could be 42177 lbs. To prevent the train from moving, a retarding force of 146692 lbs was needed from the independent brake and the hand brake. The retarding brake forces on the train were calculated and listed in Table 11.
6.1.2
Considering the QRB on MMA 5026 was not functional, its hand brake force was zero but its IND kept brake force on 12 wheels. The IND force on the other locomotives would be adjusted by 5/6 when hand brake was applied. The hand brake of VB car overtook the air brake force. The hand brake forces were adjusted by the increase ratio of 1.4 to reflect the effect of the 13 psi air brake application. Assuming the coefficient of friction was 0.38, the hand brake would contribute a retarding force of 48583 lbs, and the full IND could contribute 215546 lbs. so at the moment when full IND was applied to the train as well as the hand brakes applied on the locomotive consist and the box car, the total retarding brake force was approximately 264129 lbs, sufficient to hold the train on the grade.
6.1.3
As the IND BC reduced, the IND retarding brake force dropped. When BC dropped to 27 psi, the contribution from the IND brake was reduced to 97472 lbs, and the total retarding brake force was reduced to 146055 lbs, less than the net retarding force of 146692 lbs needed to hold the train on the grade. The train started to roll uncontrolled.
Table 11: Retarding Brake Forces on the Train Starting to Run away
| MMA 5017 | MMA VB-1 | MMA 5026 | CITX 3053 | MMA 5023 | CEFX 3166 | Box car | total | |||
|---|---|---|---|---|---|---|---|---|---|---|
| AB/HB | BC/T | @ 0.38 | ||||||||
| psi/ft-lb | lb | lb | lb | lb | lb | lb | lb | lb | lb | |
| Full IND | 72 | 146079 | 5792 | 145977 | 101931 | 141599 | 115891 | 657269 | 249762 | |
| Start to Move | 27 | 57350 | 2993 | 62765 | 50725 | 62754 | 61659 | 298246 | 113333 | |
| high power | 100 | 11731 | 11509 | 12716 | 18202 | 13526 | 17443 | 26126 | 98537 | 37444 |
| HB force corrected by 1.4 | 100 | 11731 | 16113 | 0 | 25483 | 13526 | 24420 | 36576 | 127849 | 48583 |
| Full IND @ HB | 72/100 | 121733 | 0 | 145977 | 84943 | 117999 | 96576 | 567227 | 215546 | |
| IND + HB | 72/100 | 133464 | 16113 | 145977 | 110425 | 131525 | 120996 | 36576 | 695076 | 264129 |
| BC 27 @HB | 27/100 | 47792 | 0 | 62765 | 42271 | 52295 | 51383 | 256505 | 97472 | |
| BC 27 + HB | 27/100 | 59523 | 16113 | 62765 | 67754 | 65821 | 75803 | 36576 | 384354 | 146055 |
Note:
- MMA 5026 QRB not functional, HB force zero, 12 wheel IND
- VB car hand brake overtook IND
- IND force adjusted by 5/6 when HB was on
- HD force adjusted by 1.4 upon 13 psi air brake application
6.2 Calculated minimum required hand brakes
6.2.1
The FRA/TC regulations require sufficient hand brakes to secure a train excluding the air brake force. The stationary rolling resistance in range of 4 to 6 lbs/ton helps prevent a train from run away. However, once the train was moving, the rolling resistance would reduce to approximately 2.15 lbs/ton. Calculation of the minimum required hand brakes by excluding any rolling resistance is too conservative, but the contribution of the rolling resistance should not exceed 2.15 lbs/ton, which corresponds to the scenario where train movement was initiatied by a disturbance but could be stopped by the rolling resistance at the low speed.
6.2.2
With the measured brake shoe forces from the tests, the minimum required hand brakes on the occurrence train were calculated which are related to the coefficient of friction and the hand brake application- torque and air brake application. The calculations covered four different scenarios including hand brake only with and without hand brakes on the locomotives, and the hand brake upon air brake application of 13 psi as in the occurrence, with and without hand brakes on locomotives.
6.2.3
The test data showed that the hand brakes on the tank cars were stronger than those on the locomotives because the hand brakes on the locomotives only applied on 2 wheels, while the hand brakes on the cars applied on all 8 wheels. Therefore, if the hand brakes on the locomotives were used the total number of required hand brakes would be higher than when all hand brakes applied were on the cars.
6.2.4
The calculated minimum number of required hand brakes on the occurrence train are summarized and listed in Table 12a, Table 12b and Table 12c.
Case: Hand Brakes only including HBs on Locomotive Consist (Industry Standard Practice)
| HB Torque | 80 | 100 | |
|---|---|---|---|
| 0.315 | Additional tank car HBs | 24.9 | 18.9 |
| 0.315 | Total HB number | 30.9 | 24.9 |
| 0.38 | Additional tank car HBs | 19.9 | 15 |
| 0.38 | Total HB number | 25.9 | 21 |
| 0.45 | Additional tank car HBs | 16.2 | 12 |
| 0.45 | Total HB number | 22.2 | 18 |
Case: Hand Brakes upon 13 psi Air Reduction Application including HBs on Locomotive Consist (MMA Practice on occurrence)
| HB Torque | 80 | 100 | |
|---|---|---|---|
| 0.315 | Additional tank car HBs | 17.5 | 13.2 |
| 0.315 | Total HB number | 23.5 | 19.2 |
| 0.38 | Additional tank car HBs | 13.9 | 10.4 |
| 0.38 | Total HB number | 19.9 | 16.4 |
| 0.45 | Additional tank car HBs | 11.2 | 8.2 |
Case: Hand Brakes upon 13 psi Air Reduction Application without HBs on Locomotive Consist (MMA Practice on occurrence)
| HB Torque | 80 | 100 | |
|---|---|---|---|
| 0.315 | Additional tank car HBs | 19.7 | 15.5 |
| 0.315 | Total HB number | 20.7 | 16.5 |
| 0.38 | Additional tank car HBs | 16.1 | 12.6 |
| 0.38 | Total HB number | 17.1 | 13.6 |
| 0.45 | Additional tank car HBs | 13.5 | 10.5 |
| 0.45 | Total HB number | 14.5 | 11.5 |
Note:
- Stationary coefficient of friction between brake shoe and wheel surfaces is 0.38 for normal condition (Wabtec source) and 0.45 for extremely dry clean.
- Average coefficient of friction between dry clean brake shoe and wheel surfaces is 0.315 in speed range 0-100 mph (handbook)
- Rolling resistance of 2.15 lbs/ton is used.
7.0 Conclusions
7.1
The brake leakage test of the entire locomotive consist determined that, from a fully charged brake system, the brake cylinder pressure dropped to 27 psi in 1 hour and 6 minutes due to air leakage.
7.2
The full brake system evaluation of each locomotive identified a number of defects in the brake systems of the locomotive consist. These brake components were further examined and tested by the TSB and are presented in LP185/2013.
7.3
The QRB on the second locomotive MMA 5026 was determined to be defective, which result in no hand brake application on MMA 5026 in the occurrence.
7.4
All hand brake ratios of the locomotives at the highest test torque of 200 ft-lbs were lower than 10%, with those of CITX3053 and CEFX3166 closer to 10%
7.5
The hand brake ratio of VB-1 reached much higher than those of the locomotives, but its air brake ratio is lower than those of the locomotives.
7.6
The measured shoe forces on the front trucks of CITX3053 and CEFX3166 froze during the IND BC drop from BC72 to BC 55, but did not affect the brake shoe force at BC 27. Alternative test loop was developed to eliminate the effect of this freezing phenomenon.
7.7
Assuming a coefficient of friction of 0.38, the total retarding force generated by the locomotive consist and VB car full IND air brakes was 249 762 pounds.
7.8
Assuming 100 foot-pounds of torque and a coefficient of friction of 0.38, the total retarding force generated by the locomotive consist and VB car hand brakes was 32348 pounds.
7.9
When the independent brakes were fully applied, there was enough retarding force to keep the train immobilized.
7.10
The braking force for the independent brakes at 27 psi was reduced to approximately 45% of a fully applied independent brake.
7.11
The average brake ratio for the locomotive hand brakes at 100 foot-pounds of torque was approximately 3.8%.
7.12
The brake ratio for the VB car at 100 foot-pounds of torque was 19.2%.
7.13
The brake equipment on the surviving tank cars were functional and met AAR requirements.
7.14
A single car air brake test was conducted on 2 of the surviving tank cars. Both tank cars passed the test.
7.15
The measured brake ratios of the test tank cars under AAR test reference vertical chain force of 3350 lbs for the N type hand brakes were above the AAR required 10% except Car PROX44211 whose BR was 8.2%. The 8.2% value was higher than the required hand brake ratio of 6.5% for the worn cars in service.
7.16
The applied torques corresponding to the designated test vertical chain force of 3350 lbs varied widely from 100 to 150 ft-lbs, however, the average torque was close to the AAR test reference torque of 125 ft-lbs in MSRP S-401.
7.17
At 80 foot-pounds of torque, the measured average brake shoe force of the 9 test tank cars was about 18210 lbs. Assuming a coefficient of friction of 0.38, the average retarding force generated by the hand brakes was approximately 6920 pounds per car.
7.18
At 100 foot-pounds of torque, the measured average brake shoe force of the 9 test tank cars was about 22750 lbs. Assuming a coefficient of friction of 0.38, the average retarding force generated by the hand brakes of the 9 test tank cars was approximately 8650 pounds per car.
7.19
The average measured torques on the parked vehicles on 29 August, 2013 in the MMA Farnham Yard were between 86 and 98 ft-lbs with wide variation. The difference between the existing torques and the corresponding torques after the brake air was released was between 25 to 75 ft-lbs.
7.20
The effect of the different ends on the measured brake shoe force was smaller than the variations caused by the diverging applied hand brake torques.
7.21
The difference between the hand brake upon air brake and the hand brake only was closely related to the air brake level. The increase ratios were minor for the minimum air application; approximately 1.4 for the 13 psi reduction as in the occurrence; 1.6 to 1.9 for the 20 psi reduction and full service application; and as high as 3.8 for the emergency application.
7.22
When full IND was applied and the hand brakes on the locomotive consist and the box car were applied, assuming the coefficient of friction was 0.38, the hand brake would contribute a retarding force of 48580 lbs, and the full IND could contribute 215550 lbs. Therefore the total retarding brake force was approximately 264130 lbs, sufficient to hold the train on the grade.
7.23
When BC dropped to 27 psi, the contribution from the IND brake was reduced to about 97470 lbs, and the total retarding brake force was reduced to about 146060 lbs, less than the net retarding force of 146690 lbs that needed to hold the train on the grade together with the likely stationary rolling resistance of 4.1 lbs/ton. The train started to roll uncontrolled.
7.24
The test data showed that the hand brakes on the tank cars were stronger than those on the locomotives because the hand brakes on the locomotives only applied on 2 wheels, while the hand brakes on the cars applied on all 8 wheels. Therefore, if the hand brakes on the locomotives were used, the total number of required hand brakes would be higher than when all applied hand brakes were on the cars.
7.25
With the measured brake shoe forces from the tests, the calculated minimum required hand brakes on the occurrence train were related to the coefficient of friction and the hand brake application (torque and upon air brake application).
7.26
Assuming a coefficient of friction of 0.38 in normal condition, on the day of occurrence, at least 11 additional hand brakes were needed to be applied on the tank cars at a torque of 100 ft-lbs upon the 13 psi reduction air brake.
7.27
Assuming a coefficient of friction of 0.45 in extremely dry and clean condition, on the day of occurrence, at least 9 additional hand brakes were needed to be applied on the tank cars at a torque of 100 ft-lbs upon the 13 psi reduction air brake.
7.28
If all the hand brakes were applied on the cars at a torque of 100 ft-lbs, the minimum number of hand brakes on the occurrence train upon the 13 psi reduction air brake would be 14 for normal friction condition and 12 for the extremely dry and clean condition.
7.29
Based on the industry standard practice of hand brakes only, at least 15 additional hand brakes in normal condition were needed to be applied on the tank cars at a torque of 100 ft-lbs.
7.30
If all the hand brakes were applied on the cars at a torque of 100 ft-lbs, the minimum number of hand brakes on the occurrence train without air brake involved would be 20 for normal friction condition and 17 for the extremely dry and clean condition.
8.0 References
[1]. William H. Hay, Railroad Engineering, John Wiley & Sons Inc; ISBN: 0471364002.
[2]. Paul Rhine, Locomotive Engineering Guide to Fuel Conservation, Simmons-Boardman Books, Inc. 1996; ISBN: 0911382178.
[3]. D. Chen, Brake Force Analysis, CN Freight Train, A-459-51-16, Date of Occurrence: 18-Jan-2012, TSB LP report LP021/2012, Ottawa.
This lab report is part of the Transportation Safety Board of Canada's investigation report R13D0054.
